- Healthcare 150
- Posts
- Medicare Advantage in Transition
Medicare Advantage in Transition
Structural Growth, Market Concentration, and Emerging Margin Pressures Entering 2026

I. Introduction
Medicare is the largest single source of healthcare funding in the United States and one of the most consequential economic forces shaping the industry. It influences insurer profitability, hospital revenue stability, physician reimbursement models, and the valuation frameworks applied to managed care and value-based care platforms. As enrollment expands and program design evolves, Medicare’s financial architecture increasingly determines where risk resides and how margin is generated across the healthcare system.
Over the past decade, the most significant structural shift within Medicare has been the rapid expansion of Medicare Advantage (MA). What began as a supplementary alternative to traditional fee-for-service Medicare has become the dominant coverage model for a majority of beneficiaries. More than half of eligible seniors are now enrolled in privately administered plans, fundamentally altering the distribution of financial risk between the federal government, insurers, and downstream providers. Medicare has evolved from a predominantly public reimbursement system into a hybrid public-private risk framework.
The expansion cycle from roughly 2015 through 2022 was characterized by sustained enrollment growth, broad plan proliferation, rising penetration, and strong insurer participation. Risk adjustment mechanisms supported revenue growth tied to documented clinical acuity. Star rating bonuses enhanced rebate capacity and strengthened benefit competitiveness. For large managed care organizations — including Humana, UnitedHealth Group, and CVS Health — Medicare Advantage became a primary earnings driver rather than a supplemental business line.
However, the environment entering 2026 reflects a structural transition. While enrollment continues to rise and demographic tailwinds remain intact, the economic conditions supporting margin expansion are tightening. Plan supply has begun to contract following its 2023 peak. Geographic participation has become more selective. Enrollment remains highly concentrated among scaled incumbents. At the same time, CMS rate updates have moderated relative to medical cost trends, risk adjustment methodologies are undergoing recalibration, star performance has become more difficult to sustain at higher tiers, and utilization has reaccelerated in several regions.
These developments suggest that Medicare Advantage is moving from a phase defined primarily by expansion and scale benefits to one increasingly defined by operational execution, margin discipline, and regulatory sensitivity.
This report analyzes Medicare through an economic and capital allocation lens. It examines plan availability and competitive structure, supply contraction following the 2023 peak, the continued expansion of Special Needs Plans, enrollment and penetration trends, market concentration, and the emerging economic pressure points shaping insurer profitability. The objective is not to evaluate Medicare from a policy perspective, but to assess how structural growth and tightening financial dynamics are reshaping competitive positioning across the healthcare ecosystem.
The central question entering 2026 is not whether Medicare Advantage will continue to grow — demographic forces make that outcome highly likely. Rather, it is how growth will translate into margin durability in a more mature and regulated environment. Understanding this transition is essential for evaluating insurer earnings trajectories, provider stability, and investment risk across the broader healthcare landscape.
II. Plan Availability and Competitive Dynamics in 2026
National Plan Availability
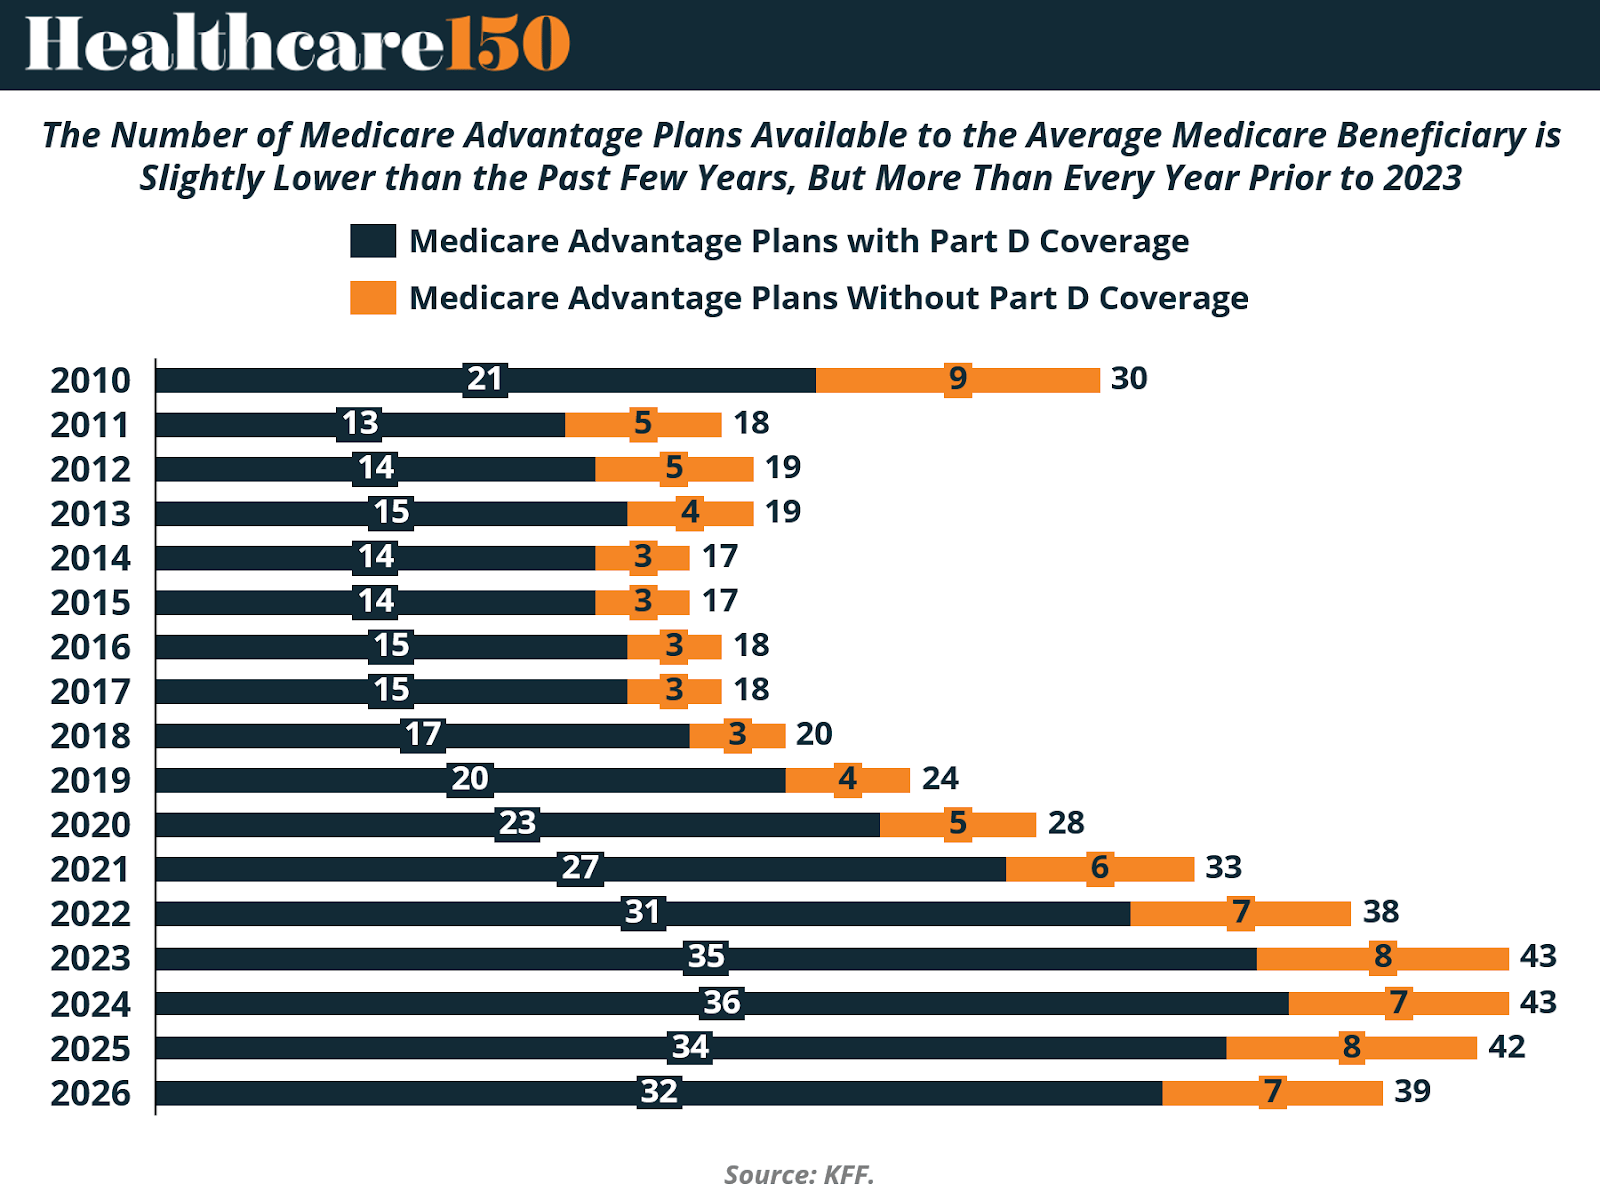
In 2026, the average Medicare beneficiary has access to 32 Medicare Advantage prescription drug (MA-PD) plans, down from 34 in 2025. This marks the second consecutive year of modest contraction following a peak in 2024, when beneficiaries had access to an average of 36 MA-PD options.
Despite this recent pullback, plan availability remains structurally elevated relative to historical levels. The 32 MA-PD options available in 2026 exceed the number offered in 2022 (31) and every year prior to that period. Viewed in a longer-term context, the competitive landscape remains significantly broader than it was throughout the 2010–2018 period, when the average beneficiary typically faced fewer than 20 MA-PD choices.
When including all individual Medicare Advantage plans — both those with and without prescription drug coverage — the average beneficiary has access to 39 total plan options in 2026, compared to 42 in 2025. These figures exclude employer- or union-sponsored group plans, Special Needs Plans (SNPs), PACE plans, cost plans, and Medicare-Medicaid plans (MMPs), which are available only to specific populations.
The recent decline in plan count does not signal a reversal of Medicare Advantage’s structural growth. Instead, it reflects a period of competitive recalibration. As CMS rate updates moderate and medical cost trends increase, insurers appear to be rationalizing geographic footprints and product portfolios. The emphasis is shifting from aggressive expansion toward margin preservation and market selectivity.
State-Level Variation and Market Exits
Plan availability continues to vary significantly across states, both in absolute terms and in year-over-year change. In 35 states, along with the District of Columbia and Puerto Rico, the average beneficiary has access to fewer MA-PD plans in 2026 than in 2025.
The largest reductions occurred in New Hampshire (13 fewer plans) and Minnesota (11 fewer plans). In Minnesota, market restructuring was particularly pronounced. UCare — the second-largest Medicare Advantage insurer in the state — exited the market for general enrollment (excluding one D-SNP plan). At the same time, UnitedHealthcare and Humana reduced their offerings, especially in more rural counties where Medicare Advantage enrollment density is lower and fixed administrative costs weigh more heavily on margins.
Several rural states continue to exhibit limited plan availability. South Dakota averages four MA-PD options, Wyoming three, Vermont one, and Alaska none. Alaska again has no MA-PD plans available in 2026, consistent with 2025 and reflecting longstanding structural challenges related to geography, provider network formation, and enrollment scale.
By contrast, six states — Alabama, Hawaii, Kansas, Missouri, Utah, and West Virginia — experienced an increase in average plan availability in 2026 relative to 2025. In eight additional states, plan availability remained unchanged year over year (including Alaska, which continues to have zero MA-PD offerings). Connecticut is excluded from these comparisons due to differences in county-level reporting between CMS enrollment and plan files.
Strategic Interpretation
The national decline in plan counts, combined with concentrated exits in certain states, suggests a shift in competitive strategy rather than systemic weakness. As Medicare Advantage penetration surpasses 50% nationally, incremental enrollment growth increasingly depends on operational execution rather than geographic expansion.
In a tighter reimbursement environment, insurers are prioritizing markets with favorable risk profiles, established provider networks, and sufficient enrollment density to absorb administrative and compliance costs. Rural and lower-enrollment counties are therefore more vulnerable to product withdrawals, while high-density markets remain competitive.
For beneficiaries, plan choice remains historically elevated. For insurers and investors, however, the data indicate that the expansion phase characterized by broad product proliferation may be giving way to a more disciplined cycle defined by portfolio optimization and margin sensitivity.
III. Medicare Advantage Plan Supply Contracts After 2023 Peak

The total number of Medicare Advantage plans available nationwide declined again in 2026, continuing the retrenchment that began after the 2023 peak.
After expanding steadily from 1,920 plans in 2016 to a high of 3,998 plans in 2023, total plan count fell to 3,959 in 2024, 3,719 in 2025, and 3,373 in 2026. While supply remains materially higher than pre-2020 levels, the directional shift is clear: the expansion cycle has slowed, and insurers are reducing plan proliferation.
The pullback has been most visible in Local PPO offerings, which grew aggressively between 2018 and 2023 but have since declined meaningfully. HMO plans — the backbone of Medicare Advantage — also peaked in 2023 before contracting over the past two years. Regional PPO and Private Fee-for-Service (PFFS) plans remain small components of the overall market and have continued to decline in relative importance.
This shift suggests a period of portfolio rationalization rather than structural demand weakness. Enrollment in Medicare Advantage continues to grow, but insurers are concentrating offerings in markets where scale, network stability, and risk-adjusted economics are more predictable. In other words, the number of beneficiaries is increasing — the number of plan SKUs is not.
The divergence between enrollment growth and plan supply contraction indicates a maturing market. During the 2018–2023 expansion phase, insurers often introduced multiple plan variations within the same county to optimize pricing tiers and star positioning. The current environment, characterized by tighter CMS rate updates, elevated medical utilization, and heightened scrutiny of risk adjustment practices, appears to be encouraging consolidation rather than proliferation.
From a competitive standpoint, fewer total plans do not necessarily imply reduced competition. Instead, the data suggest that scale players are narrowing their focus while smaller or marginal offerings are being eliminated. This dynamic is consistent with broader signals across the Medicare Advantage landscape: growth remains intact, but capital efficiency and margin discipline are becoming more central to strategy.
IV. Rapid Expansion of Special Needs Plans (SNPs)
While the total number of general Medicare Advantage plans has declined from its 2023 peak, Special Needs Plans (SNPs) continue to expand at a sustained pace, underscoring a structural shift toward higher-acuity and dual-eligible populations.
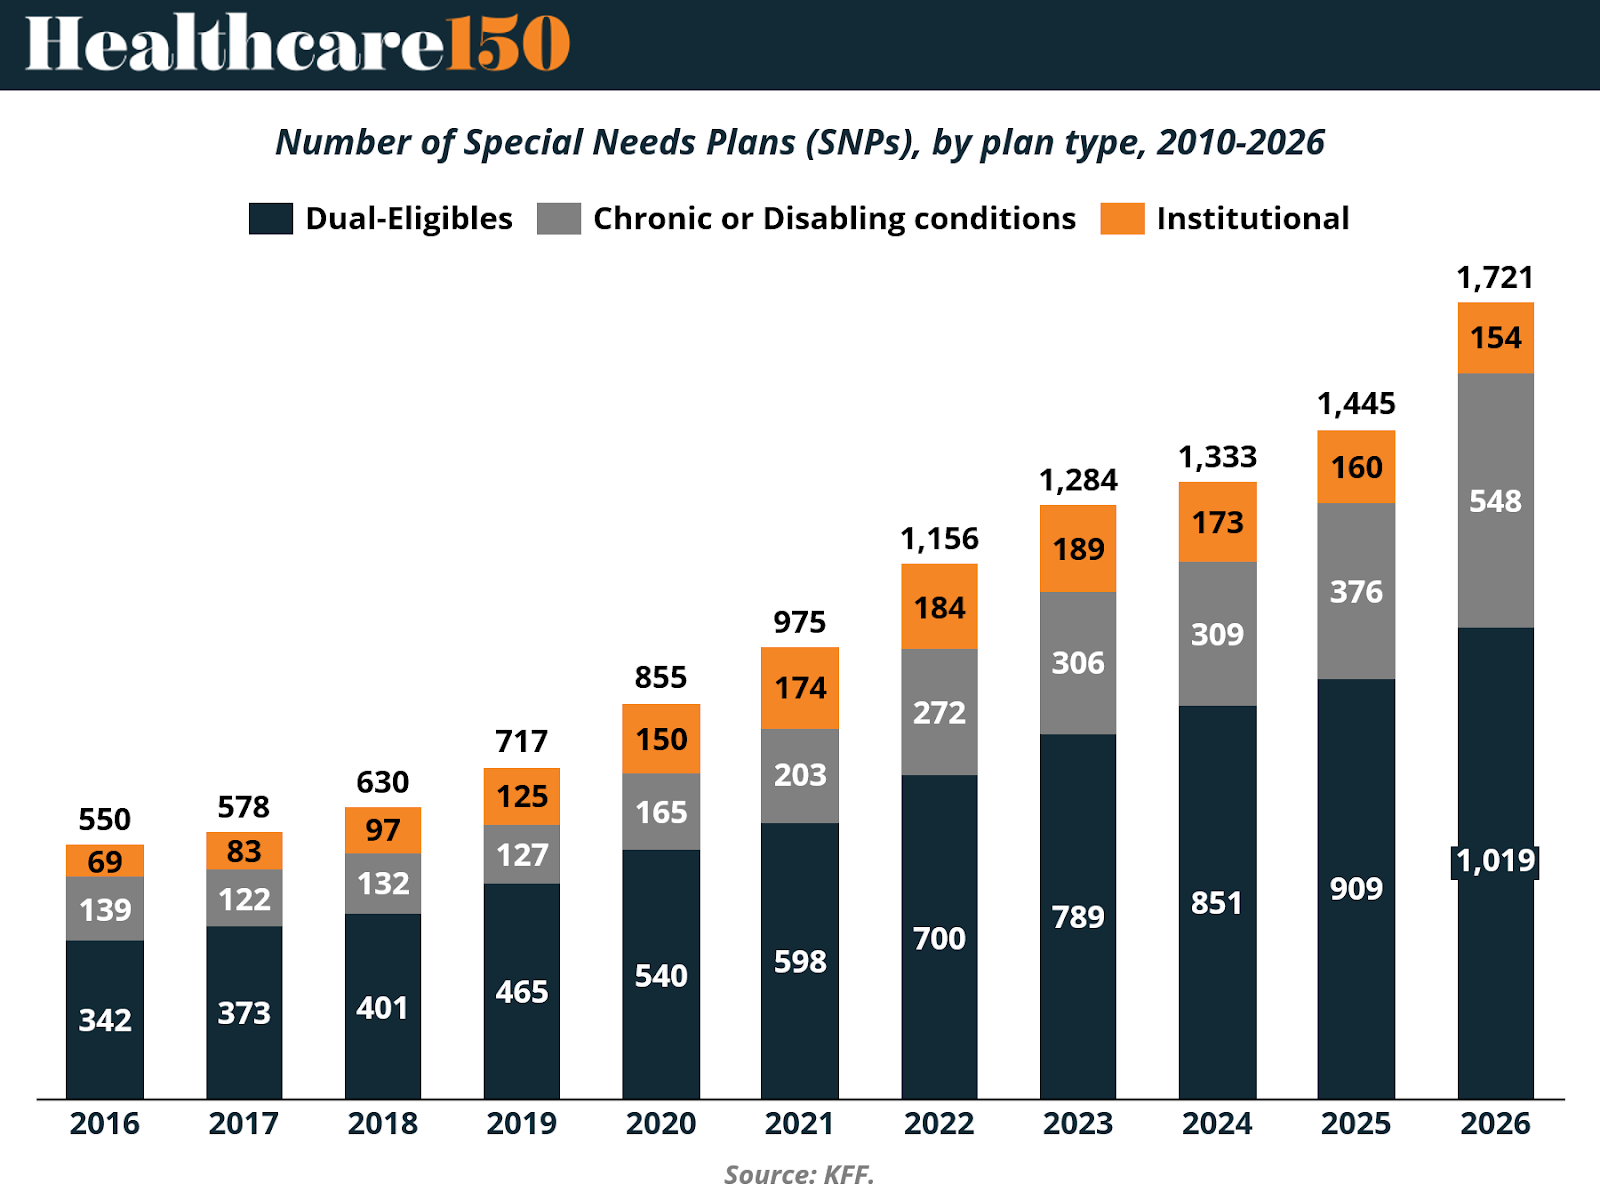
The total number of SNPs increased from 550 plans in 2016 to 1,721 plans in 2026 — more than tripling over the past decade. Growth has been consistent year over year, with particularly strong expansion between 2020 and 2026. Unlike general MA plans, SNP supply has not experienced a retrenchment phase.
The majority of this growth has been concentrated in Dual-Eligible Special Needs Plans (D-SNPs). D-SNPs increased from 342 plans in 2016 to 1,019 in 2026, representing the largest and fastest-growing segment within the SNP market. This reflects ongoing policy alignment between Medicare and Medicaid and the strategic focus of insurers on populations with higher benchmark payments and more predictable capitated structures.
Chronic Condition Special Needs Plans (C-SNPs) have also expanded meaningfully, rising from 139 plans in 2016 to 548 in 2026. The growth of C-SNPs signals increasing product specialization around defined clinical populations, including diabetes, cardiovascular disease, and other chronic conditions. Institutional SNPs (I-SNPs), which serve beneficiaries residing in long-term care facilities, have grown more modestly, increasing from 69 plans in 2016 to 154 in 2026.
This divergence between general MA plan contraction and SNP expansion is economically significant. SNPs tend to serve higher-acuity beneficiaries and often carry more complex care coordination requirements. However, they also operate within payment frameworks that can offer attractive risk-adjusted revenue profiles when managed effectively.
For insurers, the continued build-out of SNP portfolios suggests a strategic shift toward higher-risk, higher-revenue segments rather than broad-based plan proliferation. For providers — particularly those involved in long-term care, dual-eligible coordination, and value-based arrangements — SNP growth increases exposure to capitated models and integrated care structures.
From a market structure perspective, Medicare Advantage is becoming more segmented. General enrollment plan supply is stabilizing or contracting in certain geographies, while specialized products targeting dual-eligible and chronic populations continue to scale. This dynamic reinforces the view that the next phase of Medicare Advantage competition will be defined less by the number of plans offered and more by the sophistication of risk management within targeted populations.
V. Competitive Structure: Firm Participation and Market Concentration
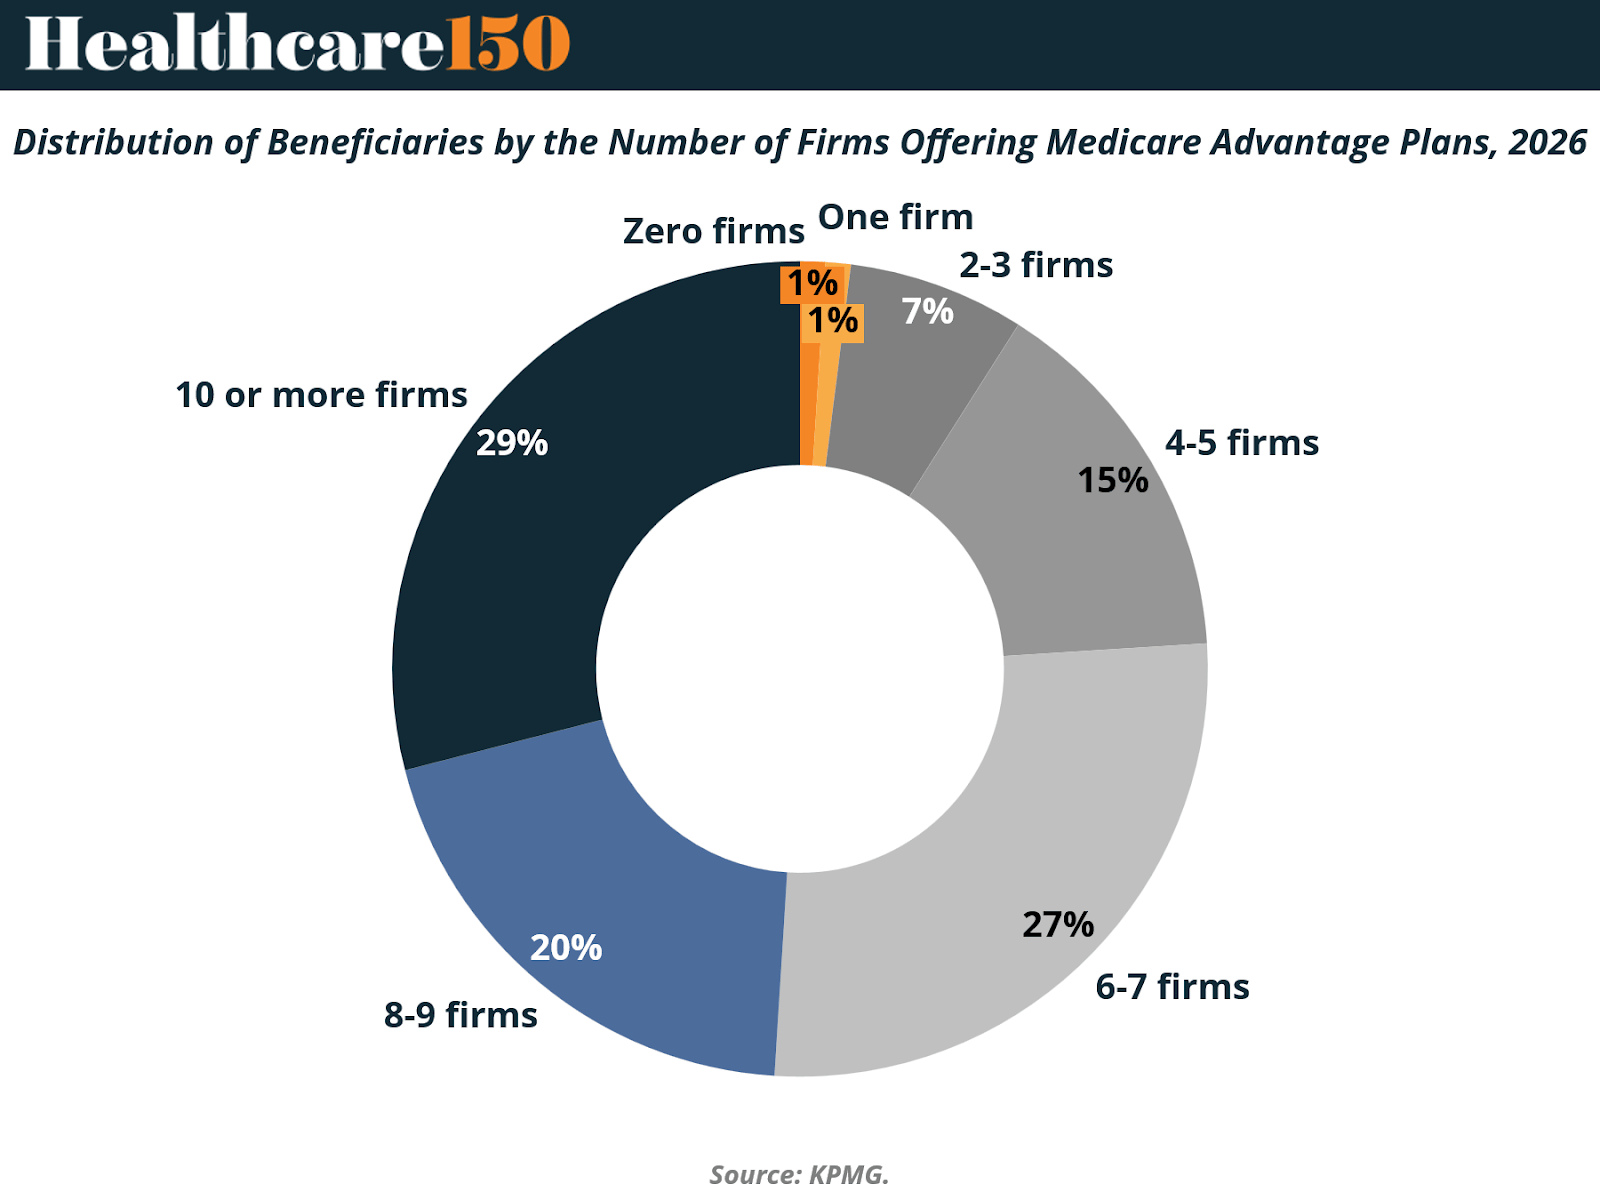
Although the average Medicare beneficiary can choose from plans offered by eight different firms in 2026 — unchanged from 2024 and 2025 — the structure of competition varies significantly across counties.
Nationally, nearly three in ten beneficiaries (29%) live in counties where plans are offered by 10 or more firms. This represents a slight decline from 31% in 2025, indicating modest consolidation in highly competitive markets. At the other end of the spectrum, 8% of beneficiaries reside in counties where only one to three firms offer Medicare Advantage plans, up from 501 counties in 2025 to 714 counties in 2026.
In 171 counties, only a single firm will offer Medicare Advantage coverage in 2026. These counties are predominantly rural and collectively represent less than 1.5% of the total Medicare population. In certain markets, beneficiaries face a complete absence of Medicare Advantage options. For example, several counties in Idaho and Vermont experienced insurer exits that left no MA plans available for general enrollment.
The Vermont market illustrates the localized nature of these competitive shifts. Vermont Blue Advantage (Blue Cross Blue Shield of Vermont) exited the Medicare Advantage market, as did UnitedHealthcare. Humana now offers plans in only five of Vermont’s fourteen counties, while the remaining counties have no Medicare Advantage offerings for 2026.
Despite broad geographic variation in firm participation, enrollment remains highly concentrated at the national level. UnitedHealth Group (through UnitedHealthcare) and Humana together account for approximately 46% of total Medicare Advantage enrollment in 2025. This concentration persists even in markets where beneficiaries technically have access to multiple competing firms.
The divergence between nominal choice and enrollment concentration is economically significant. While beneficiaries in many counties can select from numerous firms, market share continues to accrue to scaled incumbents. This dynamic reflects brand recognition, network breadth, benefit design competitiveness, and star rating performance. It also suggests that competitive intensity may be higher at the product design level than at the enrollment share level.
From a structural perspective, Medicare Advantage remains geographically competitive but nationally consolidated. Rural counties continue to face participation volatility, while urban and high-density markets sustain multi-firm competition. However, scale advantages appear to be reinforcing the dominance of the largest carriers even in counties with numerous plan sponsors.
VI. Enrollment & Penetration Trends
Medicare Advantage enrollment has grown dramatically over the past two decades, transforming from a niche alternative to traditional Medicare into a majority option for eligible beneficiaries. In 2025, more than half (54%) of Medicare beneficiaries were enrolled in Medicare Advantage plans, reflecting the continuation of this long-term trend. In absolute terms, enrollment reached approximately 34.1 million beneficiaries out of roughly 62.8 million Medicare beneficiaries with both Medicare Parts A and B.

This represents a marked increase from earlier in the last decade. For context, Medicare Advantage enrollment comprised roughly 19–20% of the eligible Medicare population in 2007, before steadily rising through policy incentive changes and market expansion. The increase in penetration has occurred in most states and across urban and suburban geographies, with some counties exhibiting particularly high penetration rates.
Growth between 2024 and 2025 continued at a moderate pace. Total Medicare Advantage enrollment grew by about 1.3 million beneficiaries (roughly 4% year-over-year), a slower pace than the high single-to-double-digit growth observed earlier in the 2010s. Emerging 2026 preliminary data similarly indicate continued growth to approximately 35 million enrollees (around 3% year-over-year), although at a historically lower rate than previous periods.
The sustained rise in Medicare Advantage penetration reflects multiple factors, including demographic tailwinds as the U.S. population ages, broad insurer participation, and the competitive appeal of bundled benefits — such as vision, dental, and hearing coverage — that are rarely available under traditional Medicare without a supplemental plan.
This growth trend is important from both a market structure and financial perspective. Higher penetration means that a larger proportion of Medicare dollars flow through capitated, private-plan payment channels rather than through original fee-for-service Medicare. It also contributes to broader systemic exposure to risk adjustment methodologies, medical cost trends, and CMS reimbursement rates — all of which are covered in subsequent sections of this report.
VII. Economic Pressure Points Entering 2026
Although Medicare Advantage enrollment continues to expand and national penetration exceeds 50%, the economic environment entering 2026 reflects a transition from margin expansion to margin management. Growth remains intact, but profitability drivers are tightening.
Moderating CMS Rate Growth
Recent CMS benchmark updates have been more restrained relative to medical cost trends. While headline rate announcements often indicate mid-single-digit increases, effective revenue growth is moderated by risk model revisions, coding pattern adjustments, and star bonus eligibility changes.
The phase-in of the updated risk adjustment model (V28) reduces the weight of certain diagnoses and dampens historical risk score growth. As a result, revenue expansion is becoming more dependent on true clinical acuity and documentation precision rather than broad-based coding uplift.
This shift narrows the margin buffer that supported earnings growth during the prior expansion cycle.
Utilization Reacceleration and Cost Pressure
Medical utilization has normalized and, in some regions, exceeded pre-pandemic levels. Inpatient volumes, outpatient procedures, and specialty pharmaceutical spending have reaccelerated, placing upward pressure on Medical Loss Ratios (MLRs).
Because Medicare Advantage plans operate under capitated structures, higher-than-expected utilization directly compresses underwriting margins. Unlike earlier periods of suppressed claims activity, the current environment reflects more typical — and in some cases elevated — cost trends.
Margin protection therefore increasingly depends on network management, care coordination, and benefit design discipline.
Star Rating Compression
Star ratings remain a critical economic lever, as plans rated four stars or higher receive quality bonus payments that increase benchmark revenue and rebate capacity.
Recent recalibrations have made it more difficult for plans to sustain higher star thresholds. A smaller share of beneficiaries are enrolled in 4+ star contracts compared to earlier years. Even modest rating declines can materially reduce bonus revenue across large enrollment bases, affecting both competitive positioning and earnings stability.
Star performance has therefore become a more volatile and strategically important determinant of financial outcomes.
RAF Scrutiny and Compliance Sensitivity
Risk Adjustment Factor (RAF) scoring continues to anchor Medicare Advantage revenue. However, regulatory oversight has intensified. CMS has expanded audit activity and reinforced enforcement through Risk Adjustment Data Validation (RADV).
The transition to the revised risk model reduces payment for certain conditions and limits historical coding-driven revenue expansion. Plans and risk-bearing provider groups are increasingly exposed to documentation precision and audit risk, introducing greater earnings variability.
Margin Discipline in a Maturing Market
Taken together — moderated revenue growth, elevated utilization, star compression, and RAF recalibration — these pressures are visible in expanding MLRs across major carriers. Even modest shifts in claims ratios can meaningfully affect operating income given structurally thin margins.
Medicare Advantage remains a durable growth platform. However, the phase defined by broad-based margin tailwinds appears to be moderating. Entering 2026, performance depends less on enrollment acceleration and more on operational efficiency, compliance rigor, and cost control.
The program is not weakening — it is maturing. And in a mature phase, execution discipline becomes the primary determinant of financial durability.
VIII. Conclusion
Medicare Advantage has completed a structural transformation over the past decade. What began as a supplemental alternative to traditional Medicare has become the dominant delivery model for a majority of beneficiaries. Enrollment continues to expand, penetration has surpassed 50% nationally, and demographic forces ensure that total program dollars will rise for years to come.
Yet the character of growth is changing.
Plan proliferation has slowed, geographic expansion is more selective, and competitive intensity is increasingly defined by execution rather than footprint. Special Needs Plans continue to scale, reinforcing a shift toward higher-acuity populations and more complex care management. At the same time, enrollment remains highly concentrated among large national carriers, underscoring the importance of scale, data infrastructure, and administrative leverage in sustaining competitive advantage.
Most importantly, the economic backdrop is tightening. Moderating CMS rate growth, reaccelerating utilization, star rating compression, and heightened risk adjustment scrutiny are narrowing the margin buffers that supported earnings expansion during the prior cycle. Revenue growth alone is no longer sufficient to ensure profitability. Financial performance now depends on medical cost discipline, documentation precision, star stability, and capital allocation efficiency.
Medicare Advantage remains the most durable revenue platform in U.S. healthcare. However, as the program matures and oversight intensifies, its economics are becoming more operationally demanding. The next phase will not be defined by whether the program grows — that trajectory is structurally supported — but by which participants can protect margin within a more regulated and cost-sensitive environment.
For insurers, providers, and investors, the implications are clear: scale, compliance rigor, and execution discipline will increasingly separate durable franchises from those more exposed to reimbursement volatility. Medicare’s expansion story is intact. Its easy-margin phase is not.
Sources and References:
CMS Medicare Advantage Rates & Statistics
How CMS Sets Medicare Advantage Rates Annually
KFF Medicare Advantage 2026 Spotlight: A First Look at Plan Offerings
KFF Medicare Advantage 2026 Spotlight: A First Look at Plan Premiums and Benefits
KFF Medicare Advantage Enrollment Update and Key Trends
KFF Quick Take: Medicare Beneficiaries and Affordability Challenges with Rising Part B Premiums in 2026
Premium Perks
Since you are an Executive Subscriber, you get access to all the full length reports our research team makes every week. Interested in learning all the hard data behind the article? If so, this report is just for you.
|

Want to check the other reports? Access the Report Repository here.