- Healthcare 150
- Posts
- Hospitals Services Costs and the Margin Playbook
Hospitals Services Costs and the Margin Playbook
Hospitals Costs growth vs Revenues, and Margin Evolution within Hospitals Services in the U.S.
Introduction: The Cost of Healthcare in a Changing Inflationary Landscape
The U.S. healthcare sector—particularly hospital systems—has been shaped by decades of rising demand, regulatory adjustments, labor pressures, and evolving payment structures. As hospitals navigate the post-pandemic economy, they face dual mandates: maintain financial sustainability and ensure patient affordability.
A central theme in this landscape is the disproportionate rise in hospital-related inflation relative to broader economic indicators. From 2004 to 2025, the Consumer Price Index for All Urban Consumers: Hospital and Related Services (hereafter, Hospitals Inflation) increased substantially faster than both All Items Inflation and Core Inflation (which excludes food and energy).
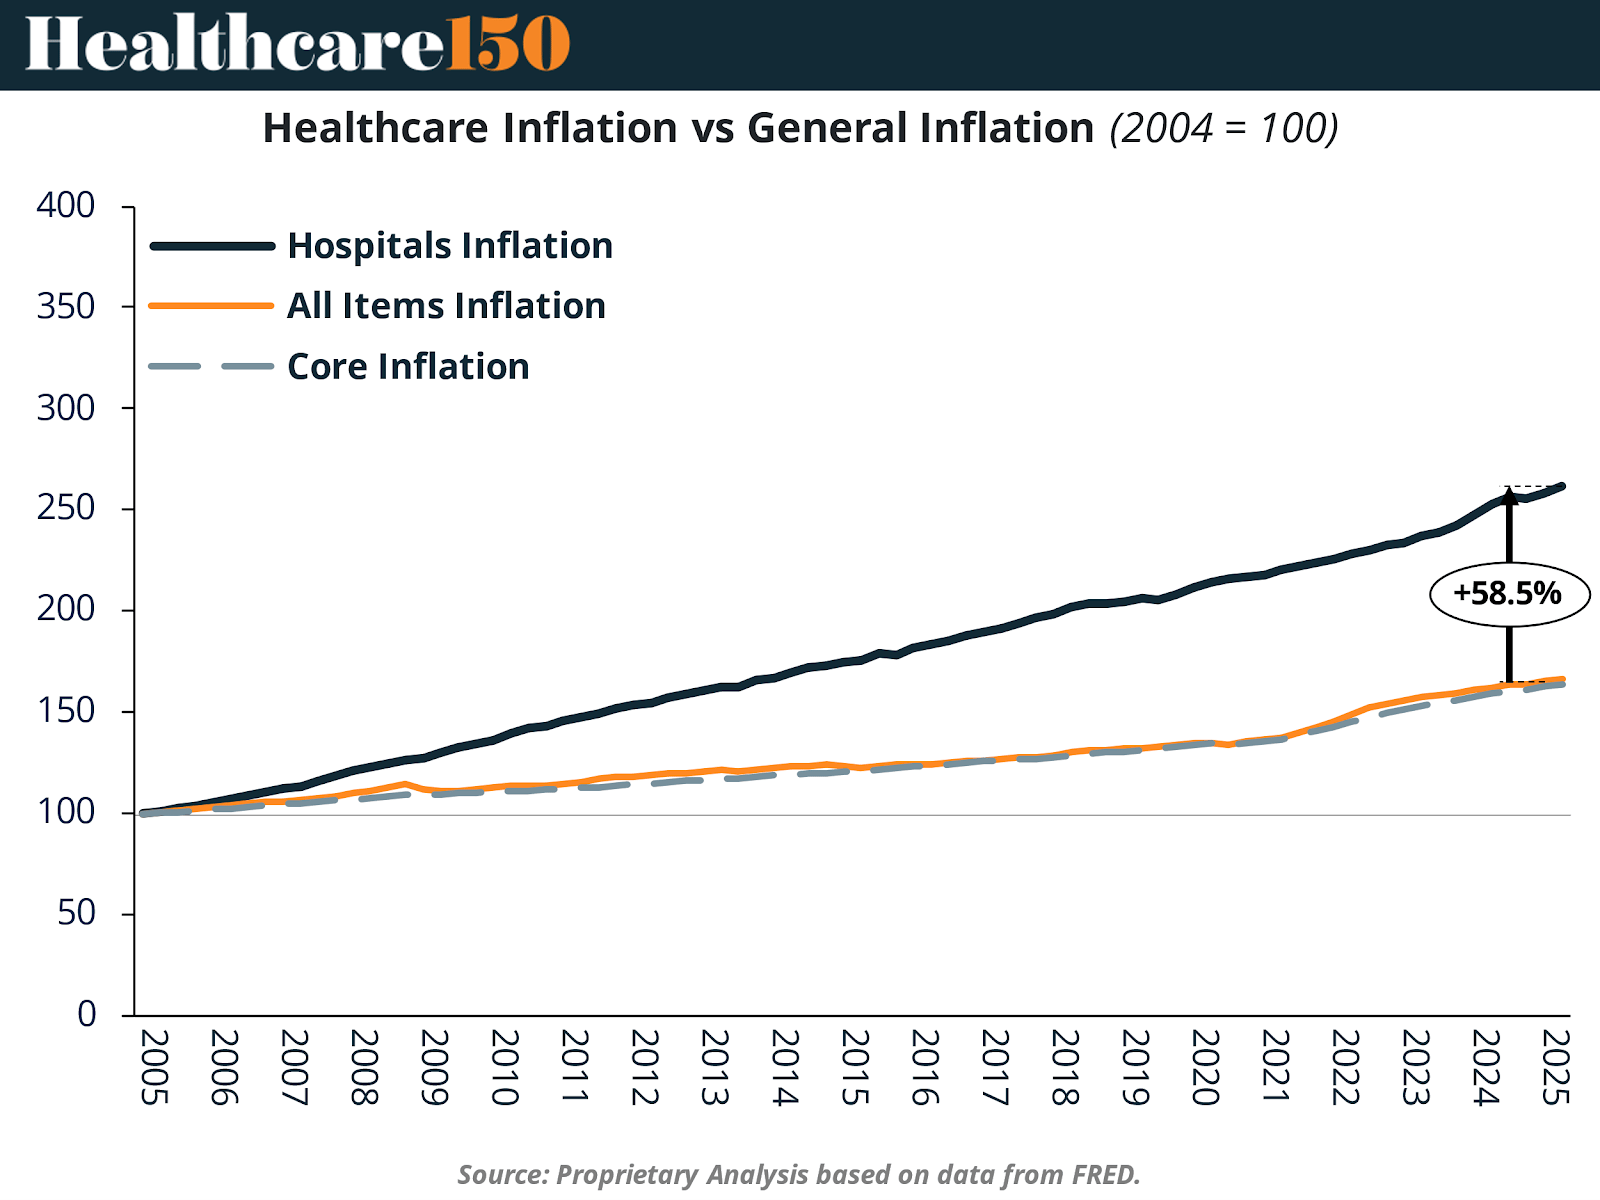
This disparity is not a short-term aberration. Instead, it reflects underlying structural pressures in the healthcare system—such as increasing labor intensity, regulatory burdens, pricing opacity, and limited competition in local markets. Hospitals, especially large systems, have greater pricing leverage with insurers, allowing prices to escalate beyond general inflation. Additionally, technology adoption and procedural specialization have driven higher-cost care models, often without proportional gains in efficiency or outcomes.
As the chart illustrates, by 2025, Hospitals Inflation had risen 58.5% more than general consumer inflation since 2004. This trend underscores the systemic cost drift in U.S. healthcare. For policymakers and payers, this growing divergence raises questions about long-term affordability, while hospitals must increasingly defend their pricing practices in the face of public scrutiny.
Revenue vs. Cost: The Hospitals’ Margin Gap and Inflation Leverage
While inflation on hospital services has climbed steeply, the Producer Price Index by Industry: General Medical and Surgical Hospitals (PPI)—which reflects hospitals' own cost inputs—has risen at a slower pace. Meanwhile, hospital revenues, measured by the Total Revenue for Hospitals, All Establishments, have grown even more rapidly, resulting in a widening gap between revenue and cost inflation.
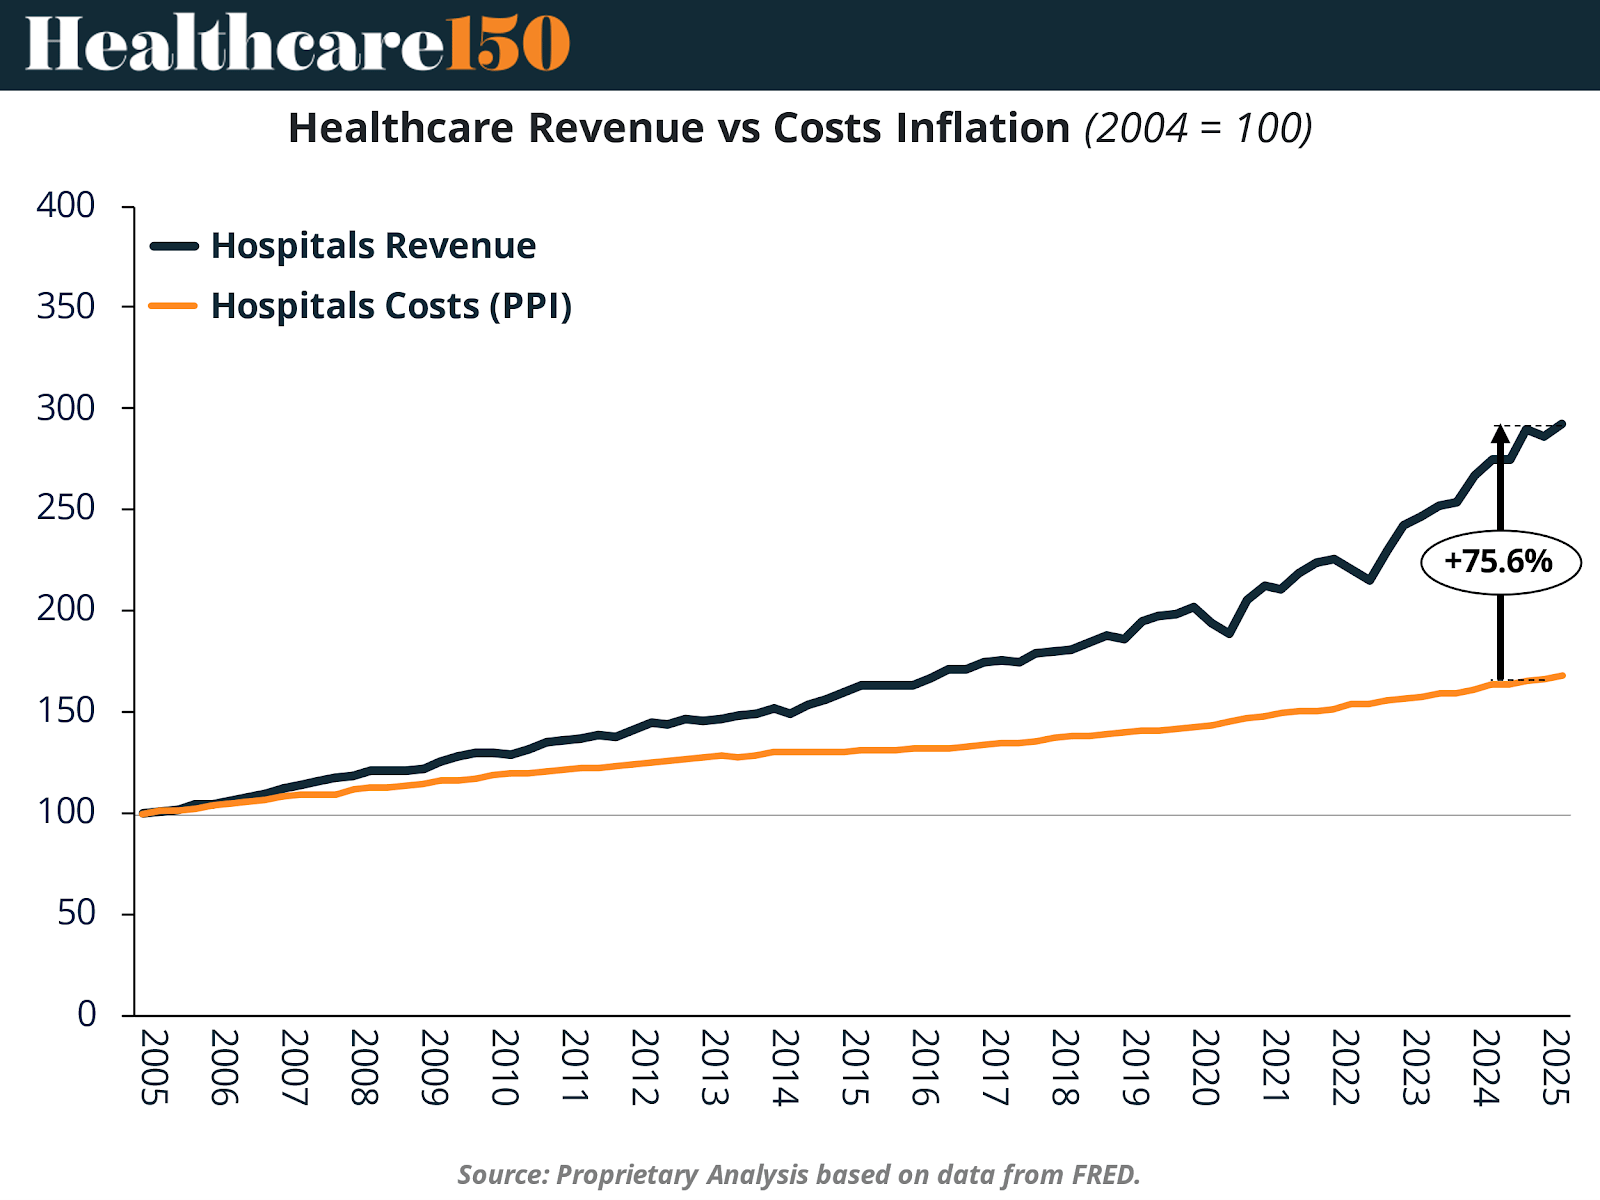
This margin gap, now estimated at 75.6%, highlights hospitals’ capacity to expand top-line growth significantly above their underlying cost structure. Several factors explain this dynamic:
Pricing power with payers: Consolidation among health systems has allowed large players to negotiate higher rates with commercial insurers.
Service intensity and mix shift: Hospitals have expanded outpatient services, surgeries, and high-margin specialties.
Volume stabilization post-COVID: After a dip in 2020–2021, patient volumes rebounded with deferred procedures and ongoing chronic care needs.
Federal relief and innovation subsidies: CARES Act funding and value-based care incentives provided financial cushions through pandemic-related disruptions.
While this performance appears positive from a fiscal perspective, it raises concerns about sustainability and equity, particularly when cost growth does not translate into proportional improvements in access or outcomes.
Recent Revenue Trends: Steady Acceleration Despite Market Headwinds
Short-term performance metrics also point to strong momentum in hospital finances. According to Kaufman Hall's April 2025 metrics, both net and gross operating revenue per calendar day show consistent growth across timeframes.
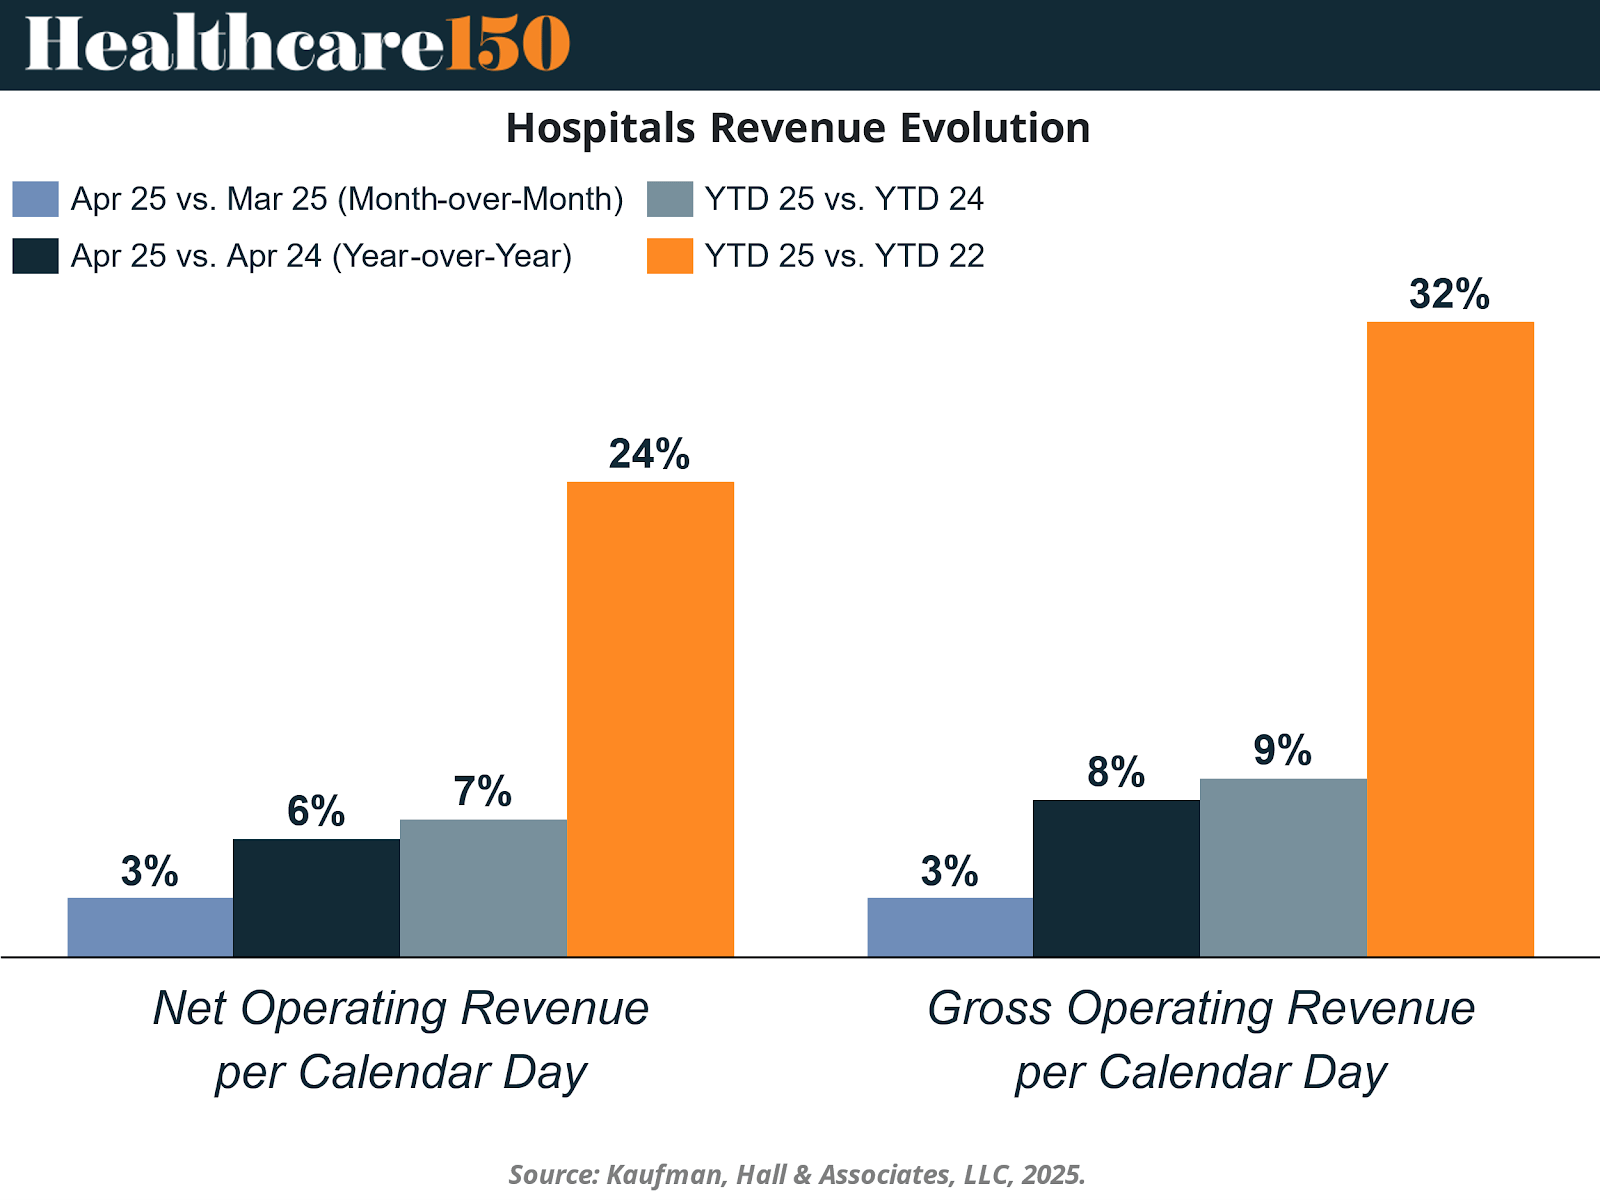
From March to April 2025, hospitals experienced a 3% month-over-month increase in both net and gross operating revenues per calendar day. Year-over-year growth from April 2024 to April 2025 reached 6–8%, and more strikingly, 24–32% growth when comparing Year-to-Date (YTD) 2025 to YTD 2022.
This revenue performance indicates resilience despite broader macroeconomic uncertainties. Key drivers include:
Strategic pricing realignments with insurers.
Revenue cycle optimization, including improved billing and collections.
Expansion in outpatient and ambulatory services, with greater throughput and lower capital intensity.
Cost Pressures: Labor, Supplies, and the Non-Labor Climb
Despite robust revenue expansion, expense growth remains a formidable challenge. From YTD 2022 to YTD 2025, total hospital expenses per calendar day rose 15%, driven by sustained pressure in several key cost categories.
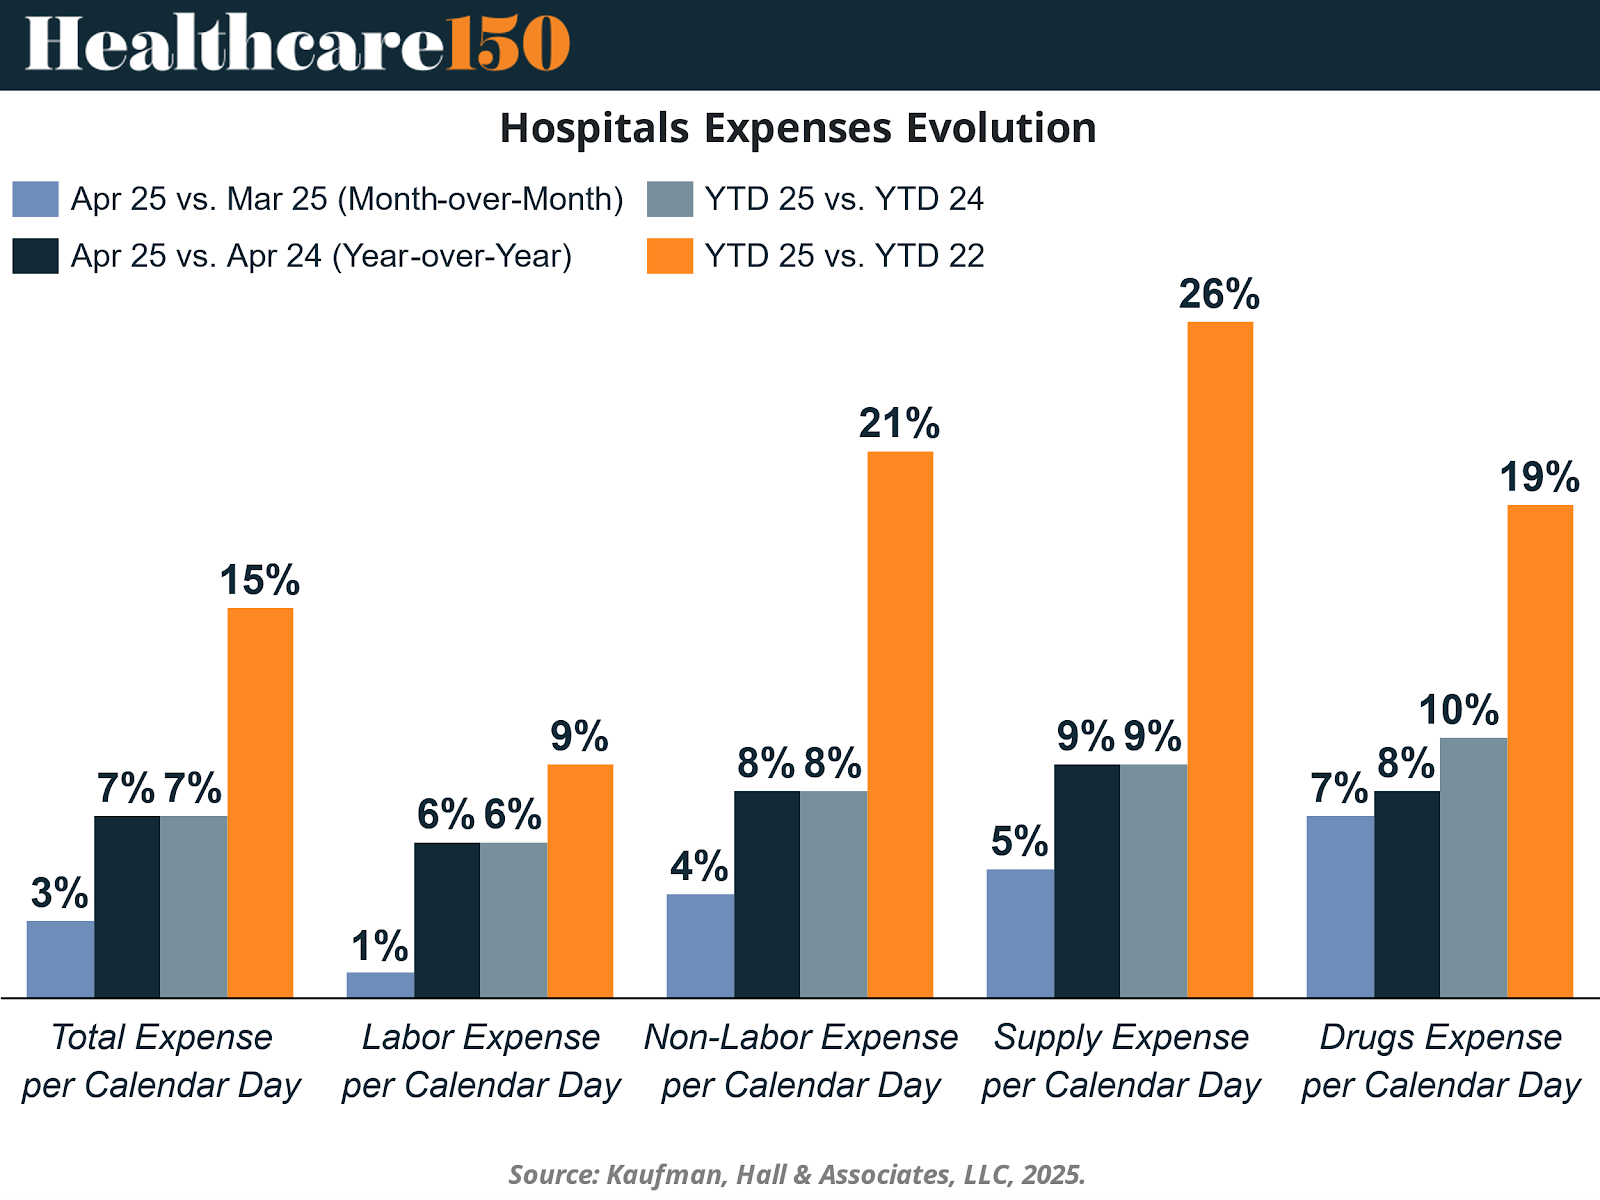
The most significant cost growth was seen in:
Supply expenses (+26%): Driven by supply chain instability, price increases in medical goods, and volume recovery.
Non-labor expenses (+21%): Including IT infrastructure, contract services, and facility management.
Drug expenses (+19%): Due to specialty drugs and inflation in pharmaceutical contracts.
Labor costs (+9%): Despite some moderation, wage inflation—particularly for nurses and allied health workers—continues to exert pressure.
These rising costs are not merely cyclical. Many are structural and tied to long-term trends such as workforce shortages, technology investment demands, and compliance mandates. Hospitals are addressing these with workforce realignment, strategic sourcing, and selective outsourcing, but the cost curve remains steep.
Profitability: Margin Resilience, with Uneven Regional Recovery
Profitability indicators show that hospitals are broadly improving their margins, even as cost pressures remain. From YTD 2022 to YTD 2025, operating margins rose 63% and operating EBITDA margins by 36%.
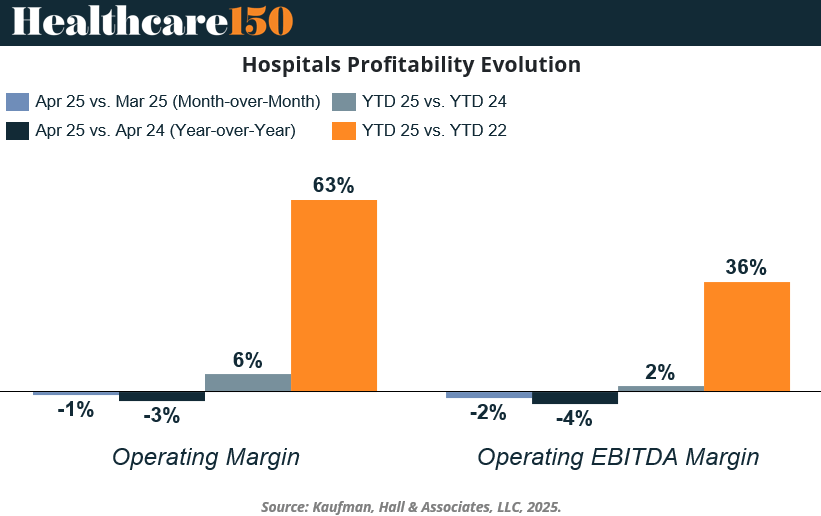
Yet, this picture is nuanced. April 2025 saw a 1–2% decline in margins compared to the prior month and 3–4% decline year-over-year. Margins remain sensitive to shifts in volume, payer mix, and fixed-cost absorption.
The regional breakdown of operating EBITDA margin paints a more complex landscape:
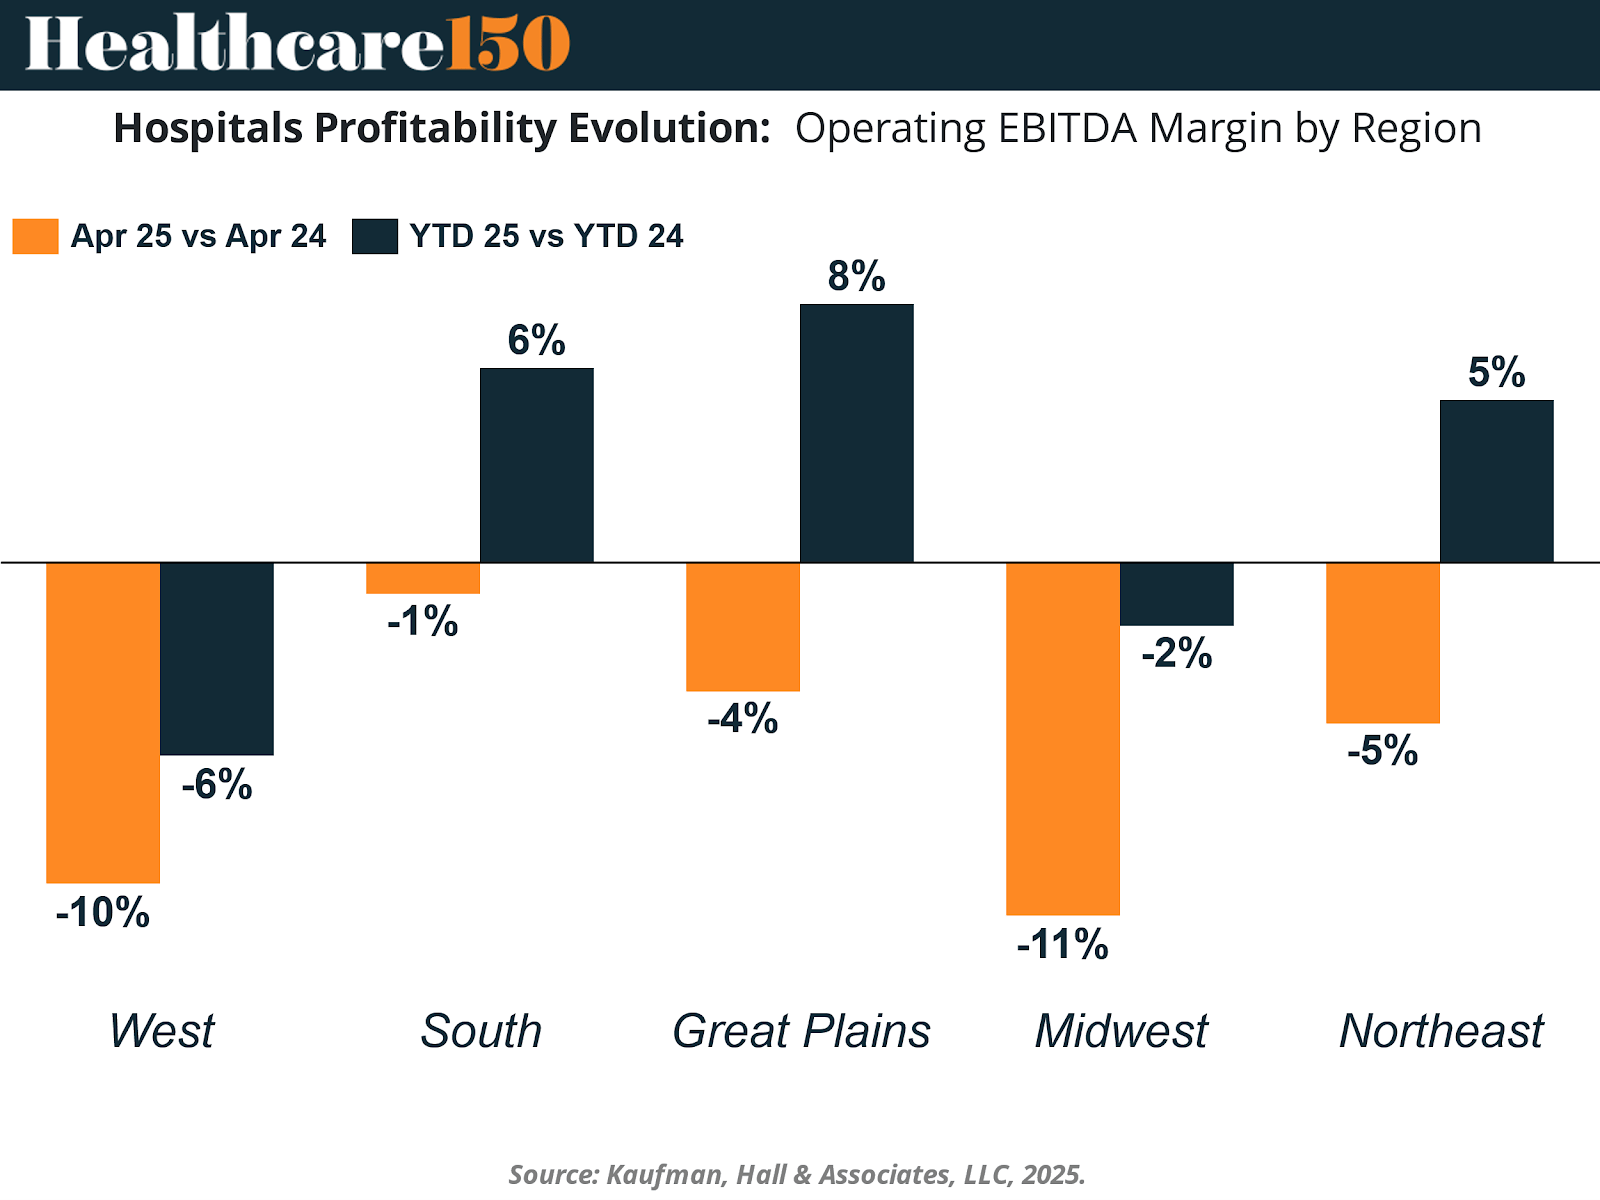
The West and Midwest regions saw the sharpest margin drops, with April 2025 margins down 10–11% vs April 2024.
The South and Northeast managed modest YTD gains, likely aided by favorable payer mixes and higher density urban markets.
The Great Plains showed mixed results with both short-term declines and longer-term gains.
Regional performance is shaped by diverse variables: demographic trends, state-level Medicaid expansions, labor market dynamics, and institutional scale. While some markets enjoy stabilizing fundamentals, others face persistent margin pressure from rural closures, recruitment gaps, or payer constraints.
Hospital Margins and Financial Performance (Q1 2025)
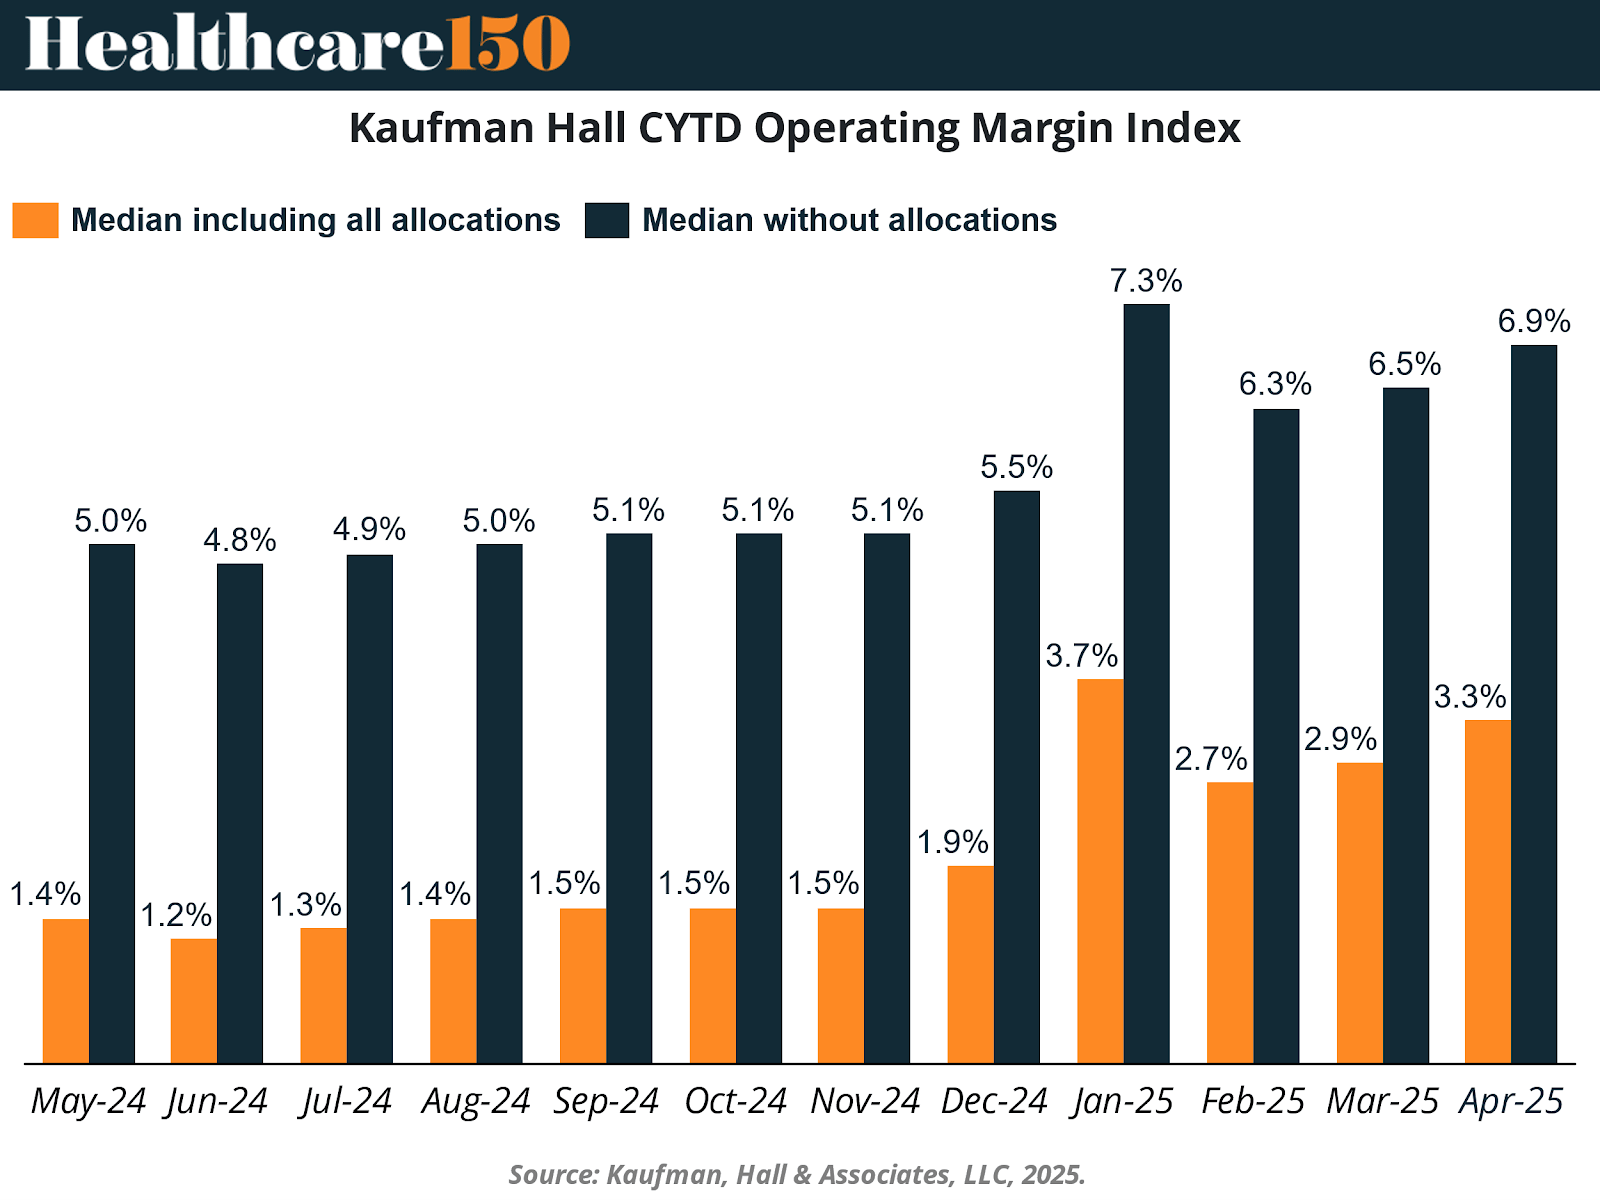
According to Kaufman Hall’s latest National Hospital Flash Report, hospitals’ financial performance in the first quarter of 2025 showed marked improvement compared to the same period in 2024.
By April 2025, the CYTD Operating Margin Index reached 3.3% when including allocations for system-wide shared services, and a robust 6.9% when excluding those allocations. This represents a 6% year-over-year increase and reflects stronger performance across patient volume, efficiency, and throughput.
Several key drivers contributed to this margin growth:
7% increase in daily net operating revenue, supported by:
A 3% increase in net patient service revenue per adjusted discharge
Growth in both inpatient and outpatient revenues
Increased patient volumes compared to Q1 2024:
4% rise in daily discharges
5% rise in adjusted daily discharges
3% increase in daily ED visits
1% increase in daily operating room minutes
1% decrease in average length of stay, indicating improved operational efficiency.
Although spending increased — 7% in total daily expenses, with labor up 6% and non-labor up 8% — hospitals managed these cost pressures through strategic staffing, process optimization, and throughput improvements.
These trends suggest that hospitals are effectively navigating current economic pressures, but structural cost risks (e.g., tariffs, Medicaid changes) remain on the horizon
The Patient Cost Burden and Strategic Policy Considerations
Despite strong hospital financials, the burden on patients remains heavy—and in many cases, growing. According to a KFF survey, over 60% of Americans report being either “very” or “somewhat worried” about their ability to afford healthcare services and unexpected medical bills.
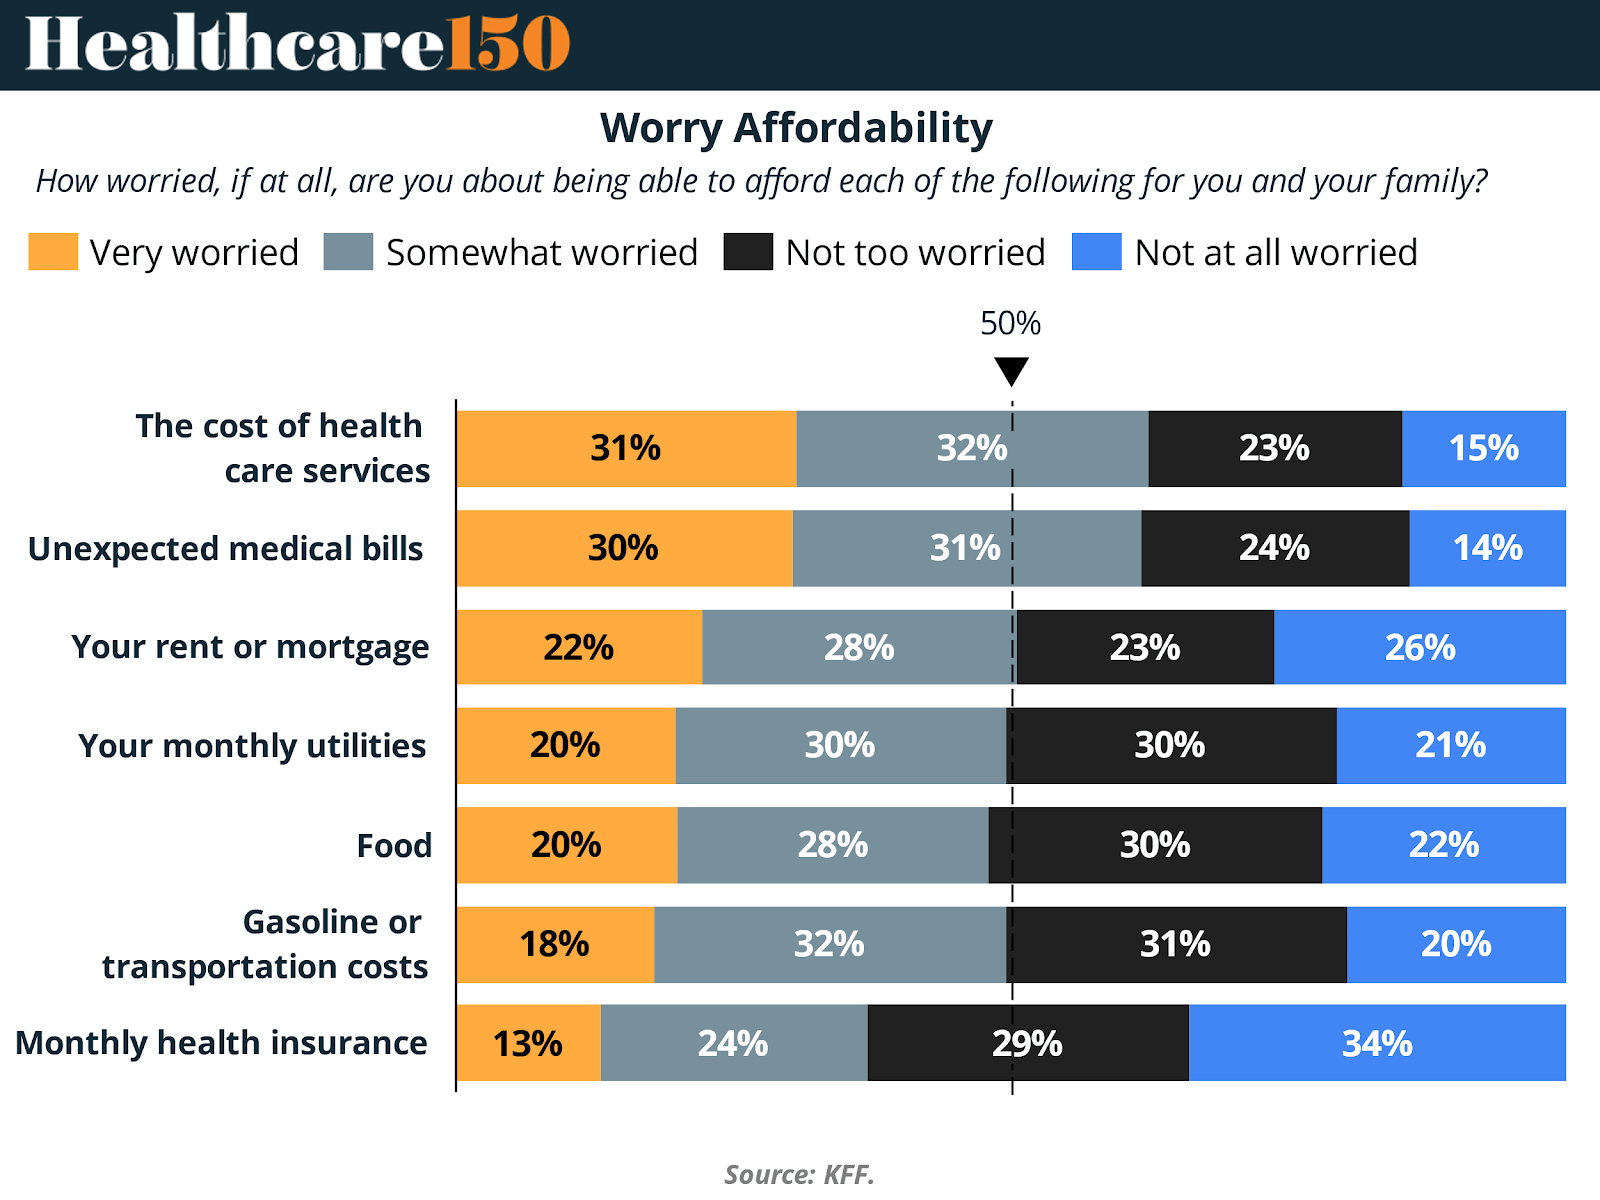
31% are “very worried” about healthcare service costs.
Nearly 30% fear unexpected medical bills.
Even basic insurance premiums and monthly costs generate affordability stress, with 13–24% of households “very worried” about coverage-related expenses.
When asked how they would handle a $500 unexpected medical bill, 19% said they could not pay at all, while 30% would go into debt to manage the cost.
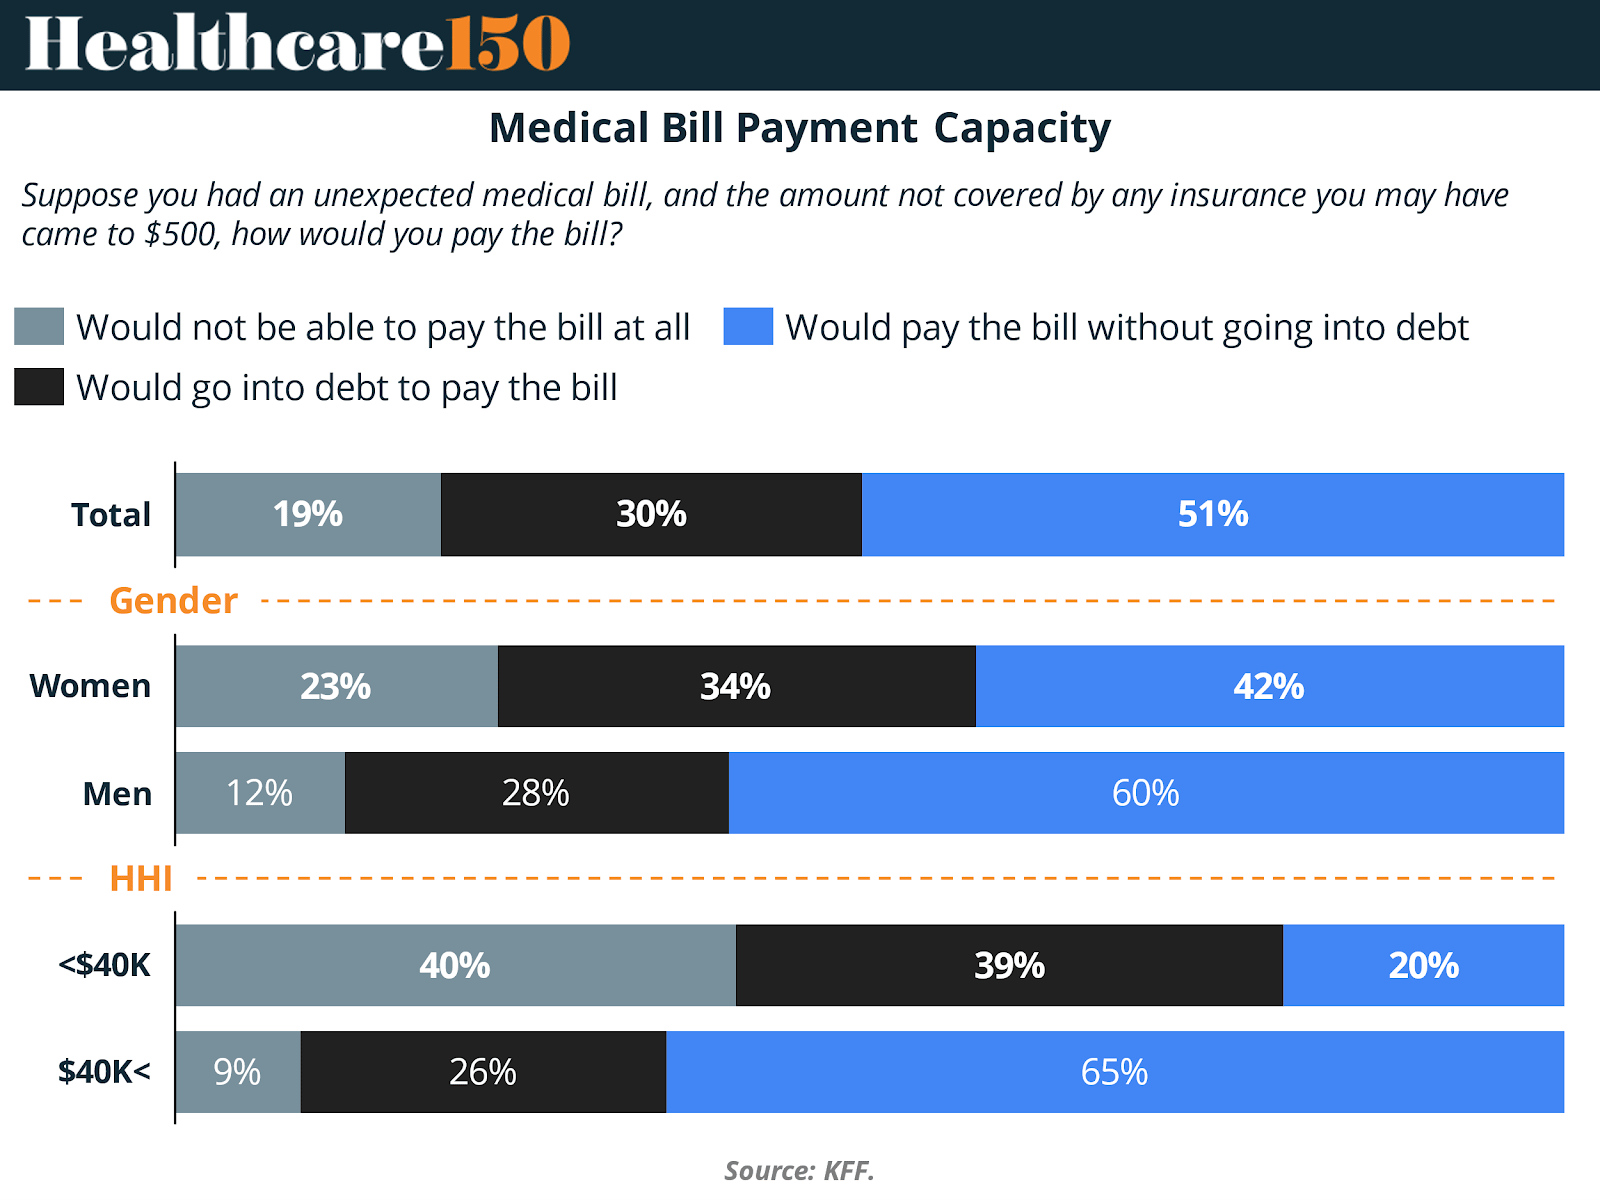
This financial fragility is more pronounced among:
Women (only 42% could pay without debt).
Households earning under $40K, where 40% cannot pay the bill at all, and 39% would go into debt.
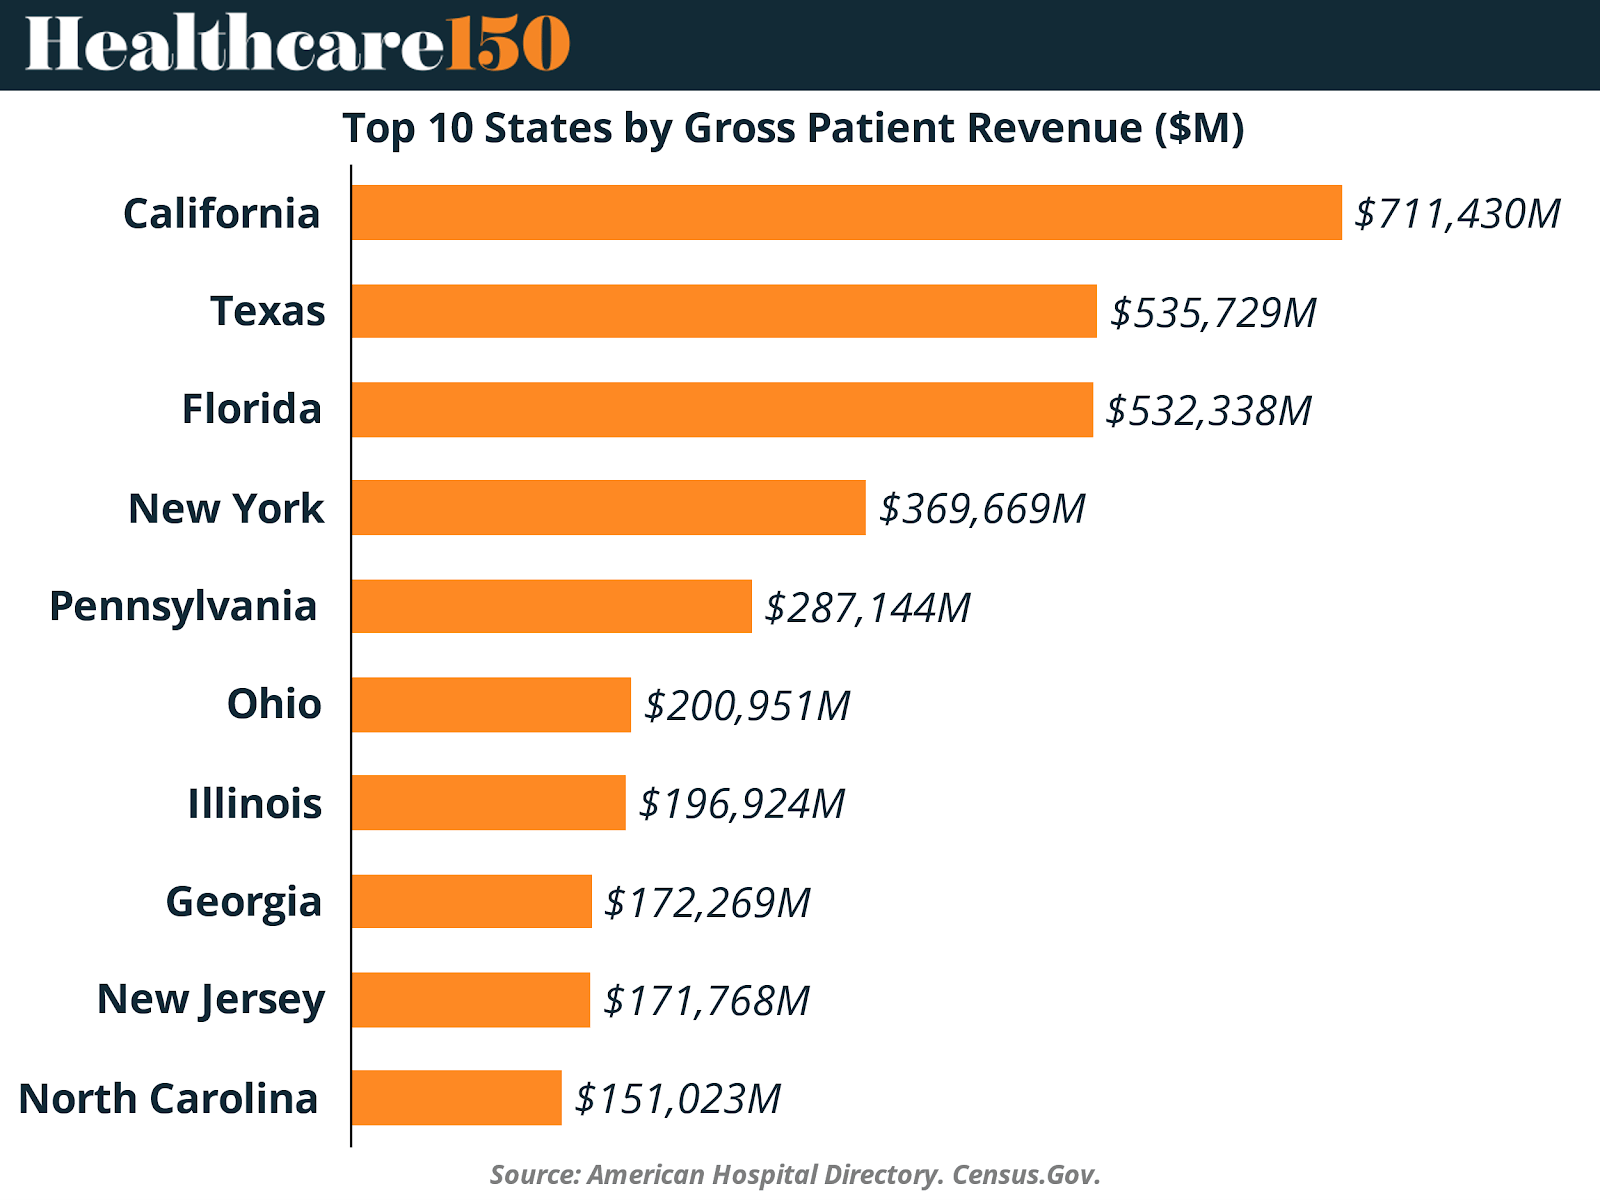
Meanwhile, hospital revenues remain highly concentrated. States like California ($711B), Texas ($535B), and Florida ($532B) dominate gross patient revenue rankings, reflecting both population size and institutional concentration.
This misalignment between hospital financial performance and consumer affordability poses a risk to the sector’s public trust. While the margin playbook is delivering results, its long-term sustainability may depend on how hospitals and policymakers balance financial growth with equity and affordability concerns.
Sources & References
Advisory Board. (2025). Charted: Hospital margins are up, but tensions remain. https://www.advisory.com/daily-briefing/2025/06/16/hospital-finances
Business Wire. (2024). U.S. Hospitals and Health Systems Market Report 2024 - Operating Margins Remain Positive Amid Declining Patient Volumes. https://www.businesswire.com/news/home/20240830835638/en/U.S.-Hospitals-and-Health-Systems-Market-Report-2024---Operating-Margins-Remain-Positive-Amid-Declining-Patient-Volumes---ResearchAndMarkets.com
Fierce. (2025). Hospitals maintain high volumes, revenues into April: Kaufman Hall. https://www.fiercehealthcare.com/providers/hospitals-maintain-high-volumes-revenues-april-kaufman-hall
Kaufmanhall. (2025). National Hospital Flash Report. https://www.kaufmanhall.com/sites/default/files/2025-06/KH-NHFR_Report%28Apr-2025-Metrics%29.pdf
KKF. (2025). Americans’ Challenges with Health Care Costs. https://www.kff.org/health-costs/issue-brief/americans-challenges-with-health-care-costs/
Strata. (2025). Hospital Operating Margins Unchanged in April, Non-Labor Expenses Continue to Climb, According to New Strata Data. https://www.stratadecision.com/press-release/hospital-operating-margins-unchanged-april-non-labor-expenses-continue-climb
Strata. Monthly Healthcare Industry Financial Benchmarks. https://www.stratadecision.com/monthly-healthcare-industry-financial-benchmarks
U.S. Bureau of Labor Statistics, Consumer Price Index for All Urban Consumers: All Items in U.S. City Average [CPIAUCSL], retrieved from FRED, Federal Reserve Bank of St. Louis; https://fred.stlouisfed.org/series/CPIAUCSL, July 17, 2025.
U.S. Bureau of Labor Statistics, Consumer Price Index for All Urban Consumers: All Items Less Food and Energy in U.S. City Average [CPILFESL], retrieved from FRED, Federal Reserve Bank of St. Louis; https://fred.stlouisfed.org/series/CPILFESL, July 17, 2025.
U.S. Bureau of Labor Statistics, Consumer Price Index for All Urban Consumers: Hospital and Related Services in U.S. City Average [CUSR0000SEMD], retrieved from FRED, Federal Reserve Bank of St. Louis; https://fred.stlouisfed.org/series/CUSR0000SEMD, July 17, 2025.
U.S. Bureau of Labor Statistics, Producer Price Index by Industry: General Medical and Surgical Hospitals [PCU622110622110], retrieved from FRED, Federal Reserve Bank of St. Louis; https://fred.stlouisfed.org/series/PCU622110622110, July 17, 2025.
U.S. Census Bureau, Total Revenue for Hospitals, All Establishments [REV622ALLEST144QSA], retrieved from FRED, Federal Reserve Bank of St. Louis; https://fred.stlouisfed.org/series/REV622ALLEST144QSA, July 17, 2025.
Premium Perks
Since you are an Executive Subscriber, you get access to all the full length reports our research team makes every week. Interested in learning all the hard data behind the article? If so, this report is just for you.
|

Want to check the other reports? Access the Report Repository here.