- Healthcare 150
- Posts
- Critical Condition, Critical Capital: Trauma Centers Enter a Growth Era
Critical Condition, Critical Capital: Trauma Centers Enter a Growth Era
In an age of increasingly specialized care, trauma centers are emerging as one of the fastest-growing—and most strategically vital—segments of the healthcare infrastructure.

Once treated as loss leaders buried in broader hospital budgets, trauma units are now being recognized as revenue-driving, outcome-critical operations that will be worth $36.2B by 2034, up from $18.7B in 2025.
This 93.6% projected growth is more than a financial trajectory—it’s a reflection of systemic shifts: urban violence, aging populations, climate-related disasters, and widening emergency care deserts.
What’s changed is the investment logic. Trauma centers are no longer just about response—they’re part of a broader ecosystem of regional command centers, surgical throughput, and acute care monetization.
Payers are recognizing the cost-saving value of specialized trauma care; private equity is circling fragmented regional players; and hospital systems are looking to trauma center designations as brand differentiators. As state and federal funds flow into emergency preparedness post-pandemic, trauma is no longer niche—it's core strategy.

Key Takeaways From Chart:
Market to nearly double in size from $18.7B (2025) to $36.2B (2034), reflecting a 7.7% CAGR over the decade.
Growth driven by rising incidents of trauma (violence, accidents, natural disasters) and aging populations with higher fragility risk.
Reimbursement models are evolving, with CMS and private payers incentivizing trauma activation and rapid intervention capabilities.
Investment tailwinds: Systems are investing in trauma upgrades for brand differentiation and higher-acuity case mix.
Opportunity for M&A roll-ups: Many trauma centers still operate in fragmented systems—ripe for PE-backed platform plays.
From Coverage Gap to Network Buildout: Trauma Centers Multiply Across the U.S.
The U.S. trauma system has undergone a quiet but dramatic expansion. In 2002, there were just 1,154 designated trauma centers nationwide. As of 2023, that number has surged to 2,076, marking an 80% increase over two decades.
The fastest growth? Levels III through V—centers that provide stabilization and transfer services, often in rural or underserved regions where timely access to critical care can be the difference between life and death.
This growth isn’t accidental. It's the result of a deliberate national shift to close geographic gaps, address disparities in trauma access, and relieve pressure on overcrowded urban Level I and II centers. States are incentivizing trauma designation; payers are rewarding readiness; and systems are diversifying their emergency footprint.
For investors and strategics, the story is one of scale meeting acuity—and a roadmap to where capital deployment and operational partnerships are most needed.

Key Takeaways From Content:
Total U.S. trauma centers grew from 1,154 in 2002 to 2,076 in 2023—an 80% expansion.
Level III centers nearly doubled, rising from 251 to 465, signaling increased demand for intermediate trauma stabilization facilities.
Level IV and V centers surged from 450 to 1,065, reflecting aggressive rural and suburban coverage expansion.
Level I centers grew modestly (190 → 220), underscoring their role as high-acuity anchors, not growth engines.
Strategic focus is shifting from flagship trauma hubs to scalable regional networks—particularly in value-based and emergency transport models.
The Golden Hour, Expanded: How Trauma System Reach Is Closing the Survival Gap
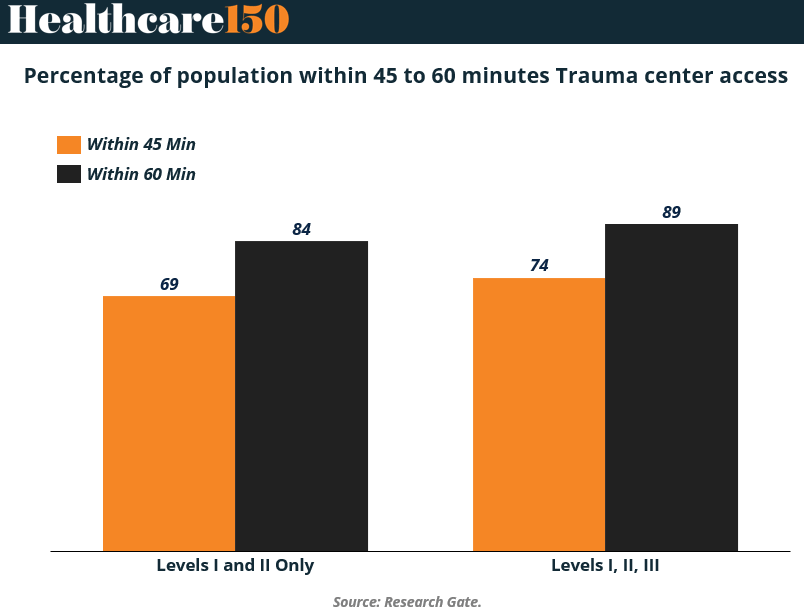
In trauma care, minutes matter—and access within the first 60 minutes, often called the “golden hour,” can be the difference between recovery and fatality. This chart lays out the impact of expanding the trauma system beyond just Level I and II centers.
When only these highest-acuity centers are considered, 84% of the U.S. population lives within 60 minutes of care. But when Level III centers are included, that jumps to 89%. At the 45-minute mark, the jump is equally telling: 69% to 74%.
This isn’t just about physical proximity—it’s about systems design. Level III centers, while not comprehensive trauma hubs, serve as crucial triage and stabilization nodes, particularly in rural and semi-urban areas.
Their addition to the trauma network has brought the U.S. closer to a model of geographically distributed, functionally integrated emergency care. For investors and health system planners, these numbers are more than reassuring—they’re a call to scale and optimize across levels of care.
Key Insight From Chart:
84% of the U.S. population lives within 60 minutes of a Level I or II trauma center; 89% when Level III is included.
At the 45-minute access threshold, coverage improves from 69% to 74% when Level III is added—capturing millions of additional lives.
Level III centers act as access multipliers, bringing timely trauma care to areas previously classified as underserved or trauma deserts.
This expanded access aligns with value-based outcomes and regionalized emergency care strategies.
Expect continued investment in Level III designations, EMS integration, and teletrauma linkages to Level I/II facilities.
America’s Front Door to Trauma: The Scale—and Strain—of Emergency Departments
If trauma centers are the backbone of acute care, emergency departments (EDs) are the front door—and that door is constantly in motion. In the U.S., EDs handle a staggering 155.4 million visits annually, with 43.5 million of those tied to injury-related cases.
But the bottleneck is real: only 17.8 million of those visits result in hospital admission, and just 3.1 million escalate to critical care. The vast majority are evaluated, treated, and discharged—underscoring the ED’s dual role as both a clinical triage system and a public health pressure valve.
For trauma systems, these numbers are more than operational stats—they’re indicators of systemic exposure and strategic capacity gaps. With such high volumes, even marginal improvements in ED efficiency, care routing, or triage automation could yield significant downstream impact.
On the flip side, surging demand without parallel investment in trauma-capable infrastructure risks overcrowding, delayed interventions, and rising morbidity. For hospital executives, payers, and policymakers alike, ED data is both a stress test and a strategic blueprint.

Key Takeaways From Chart:
155.4M annual ED visits in the U.S., with 43.5M (28%) tied to injury-related causes.
Only 11.5% of visits (17.8M) result in hospital admission, showing high volume but selective escalation.
Just 2% (3.1M) of ED visits lead to critical care unit admission, revealing the ED's broad filtering role.
The data highlights the centrality of EDs in trauma response—where rapid decisions determine whether a case advances or is deflected.
For trauma care investors, this reinforces the case for triage optimization, care coordination platforms, and urgent care integration to offload low-acuity volumes.
Sources & References
Precedence Research. Trauma Centers Market Size. https://www.precedenceresearch.com/trauma-care-centers-market
CDC. Emergency Departmentshttps://www.cdc.gov/nchs/fastats/emergency-department.htm
ResearchGate. Population percentages. https://www.researchgate.net/figure/Population-Percentages-With-Trauma-Center-Access-by-US-Census-Regions-and-States_tbl1_273353508
Journals. Trauma Center Proliferation. https://journals.lww.com/otainternational/fulltext/2025/03000/trauma_center_proliferation_in_the_united_states_.11.aspx
Premium Perks
Since you are an Executive Subscriber, you get access to all the full length reports our research team makes every week. Interested in learning all the hard data behind the article? If so, this report is just for you.
|

Want to check the other reports? Access the Report Repository here.